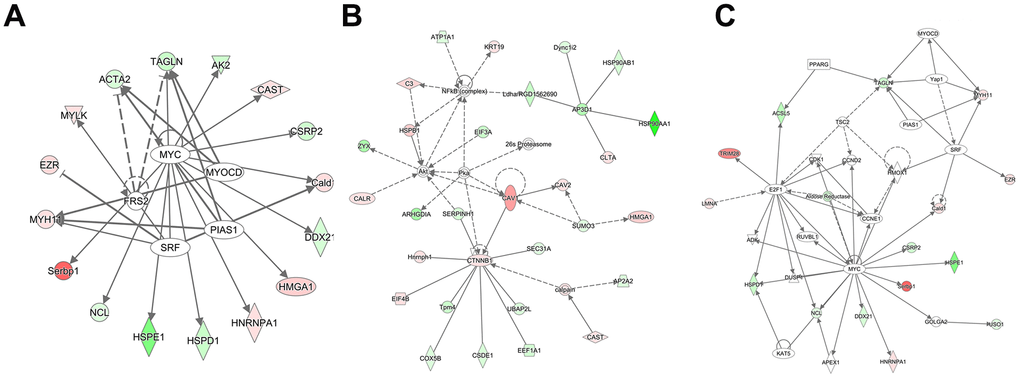
Figure 5.Analysis of the interaction network and upstream effects of the 827 DEPs and their precursor proteins. (A) Analysis of upstream effects in these biological events. (B) Networks related to endocrine system disorders, organismal injury, and abnormalities. (C) Networks related to cell cycle, cell death and survival, and gene expression. The intensity of the node color reflects the degree of upregulation (green) or downregulation (red).