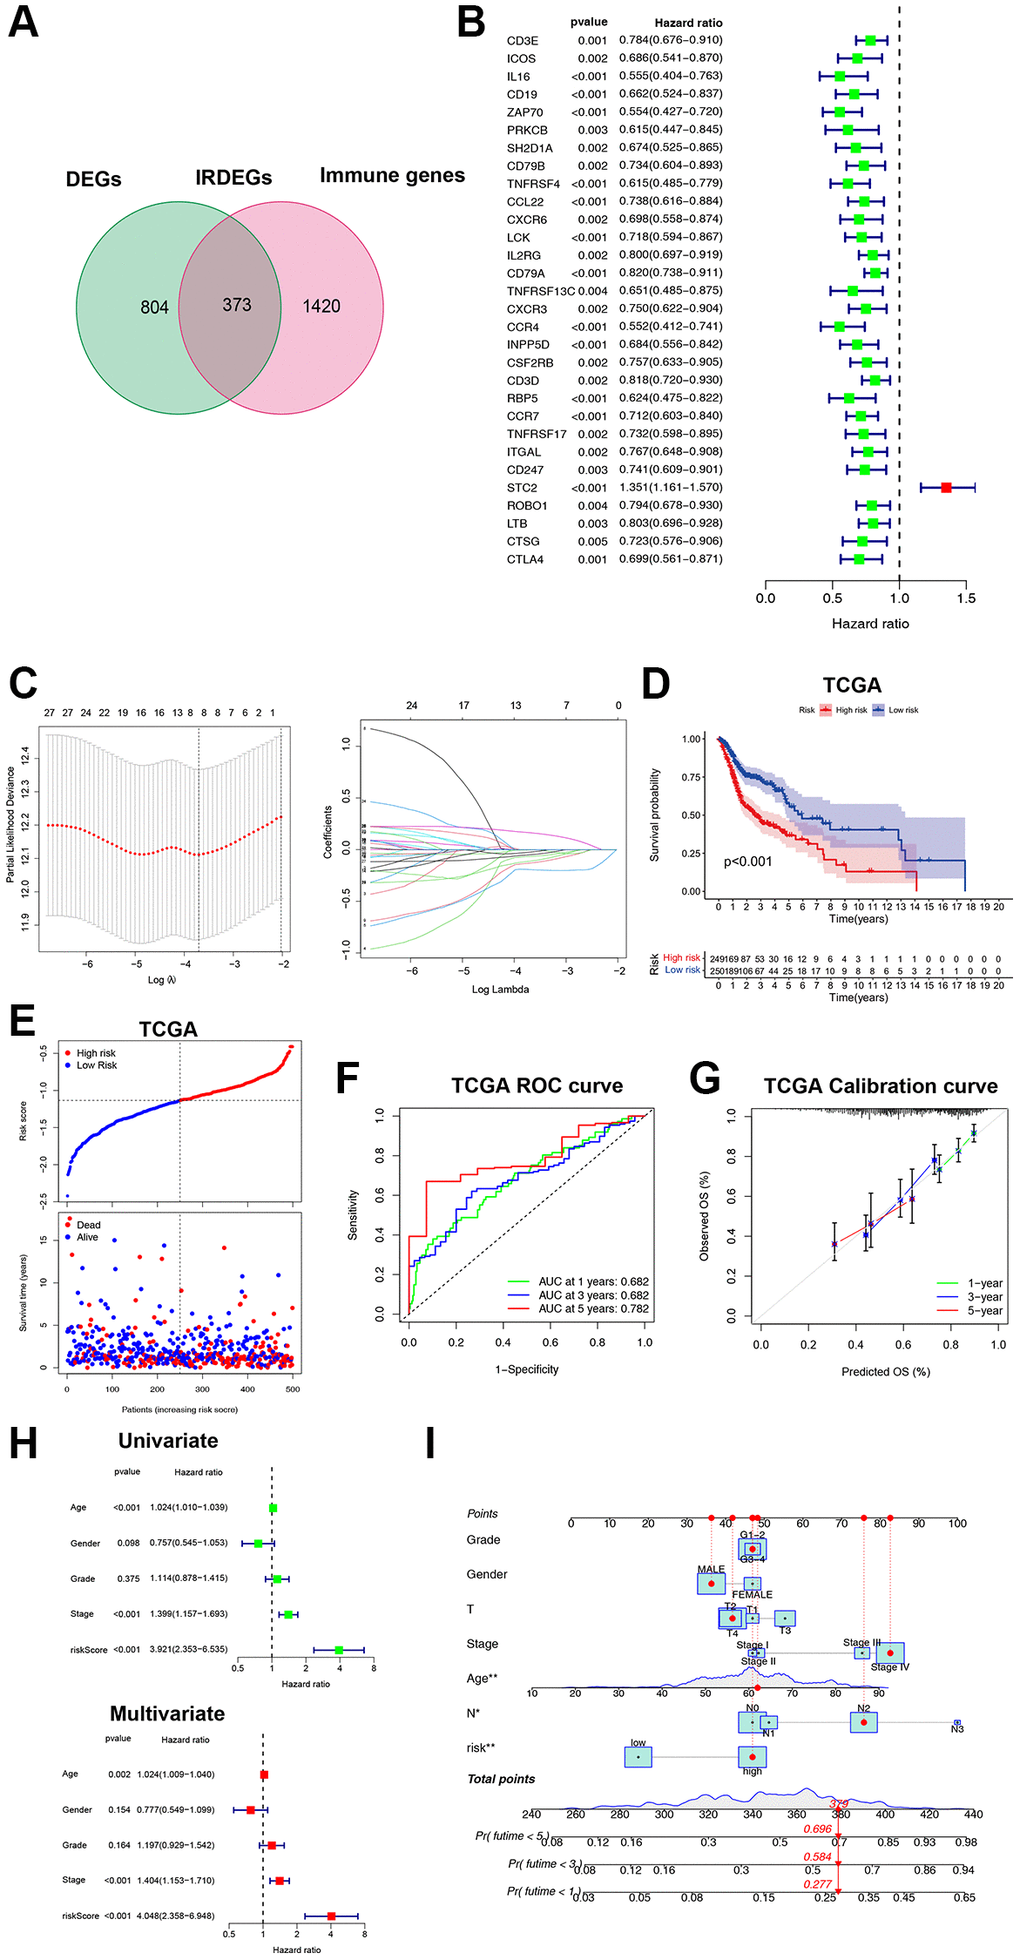
Figure 2.Construction and validation of the ICF gene signature. (A) Venn diagram shows 373 IRDEGs. (B) Univariate Cox analysis for PIGs. (C) Lasso regression analysis of PIGs. (D) Comparison of overall survival between high- and low-risk groups. (E) The correspondence between ICF risk scores and survival outcomes in the training set. The ROC curve (F) and calibration curve (G) of the ICF score for predicting 1-year, 3-year and 5-year survival. (H) Univariate and multivariate survival analyses of ICF score and clinical traits. (I) Nomogram based on the ICF score and clinical traits for predicting 1-year, 3-year and 5-year survival. *p < 0.05, **P < 0.01.