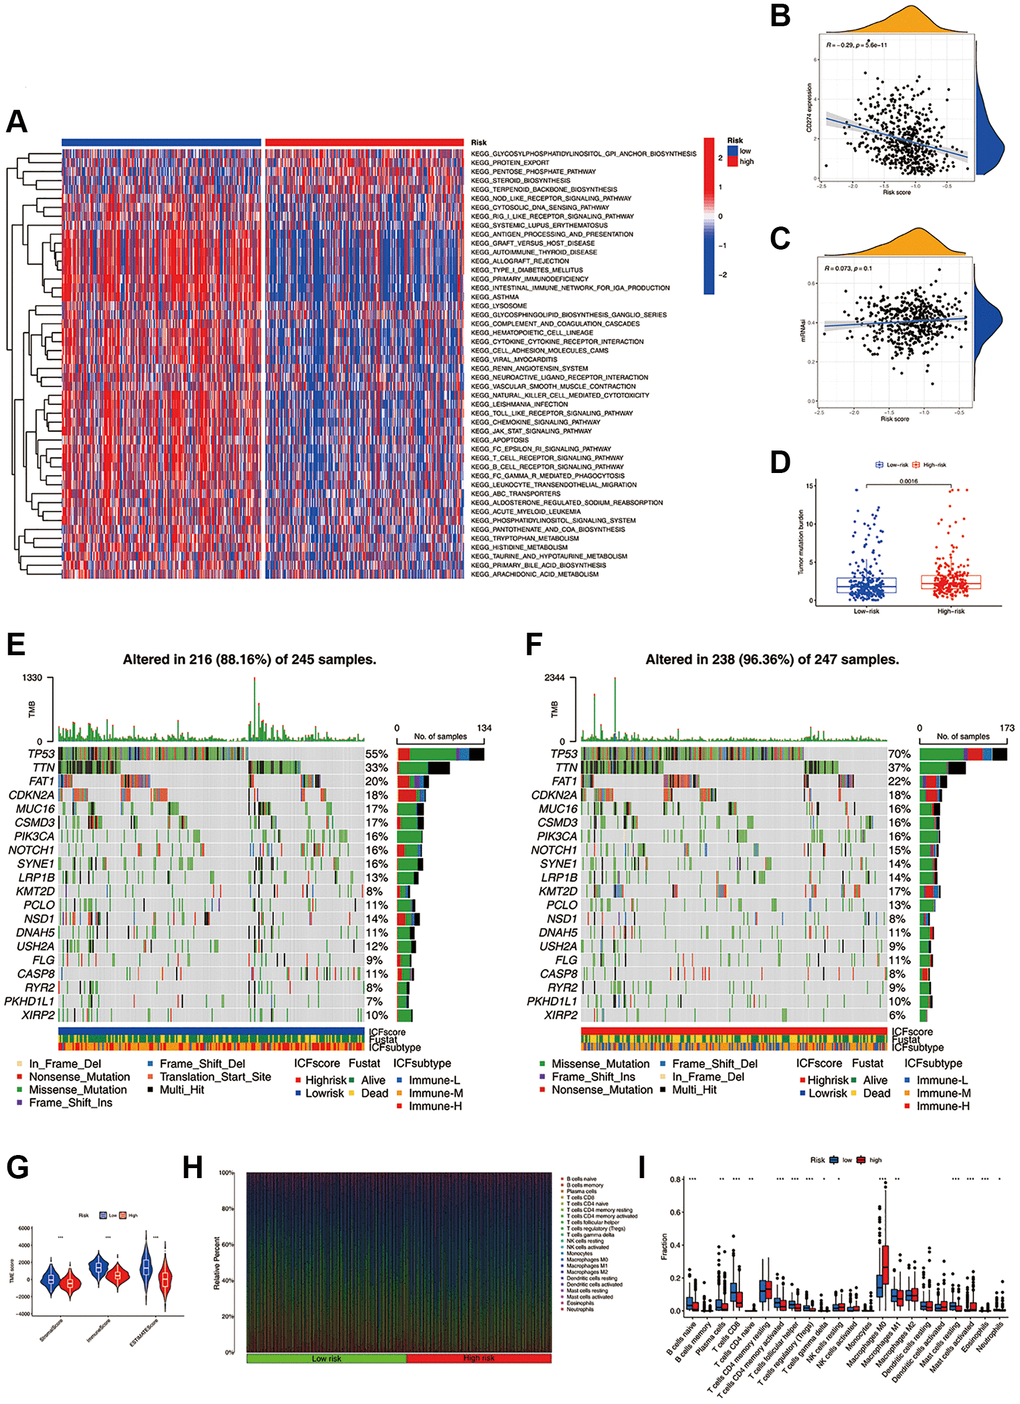
Figure 4.Molecular mechanisms and the TME landscape of different ICF risk groups. (A) GSVA of KEGG pathways in high- and low-risk groups. (B) Correlation of the ICF score and the expression of immune checkpoint CD274 (PD-L1). (C) Correlation of the ICF score and cancer stemness indices (mRNAsi). (D) Comparison of TMB between high- and low- risk groups. The landscape of somatic variance of the low-risk group (E) and high-risk (F) group. (G) Comparisons of TME components between high- and low-risk groups. (H) The bar plot shows the fractions of 22 immune infiltrating cells in high- and low-risk groups. (I) Comparisons of the proportions of 22 immune infiltrating cells between high- and low-risk groups.