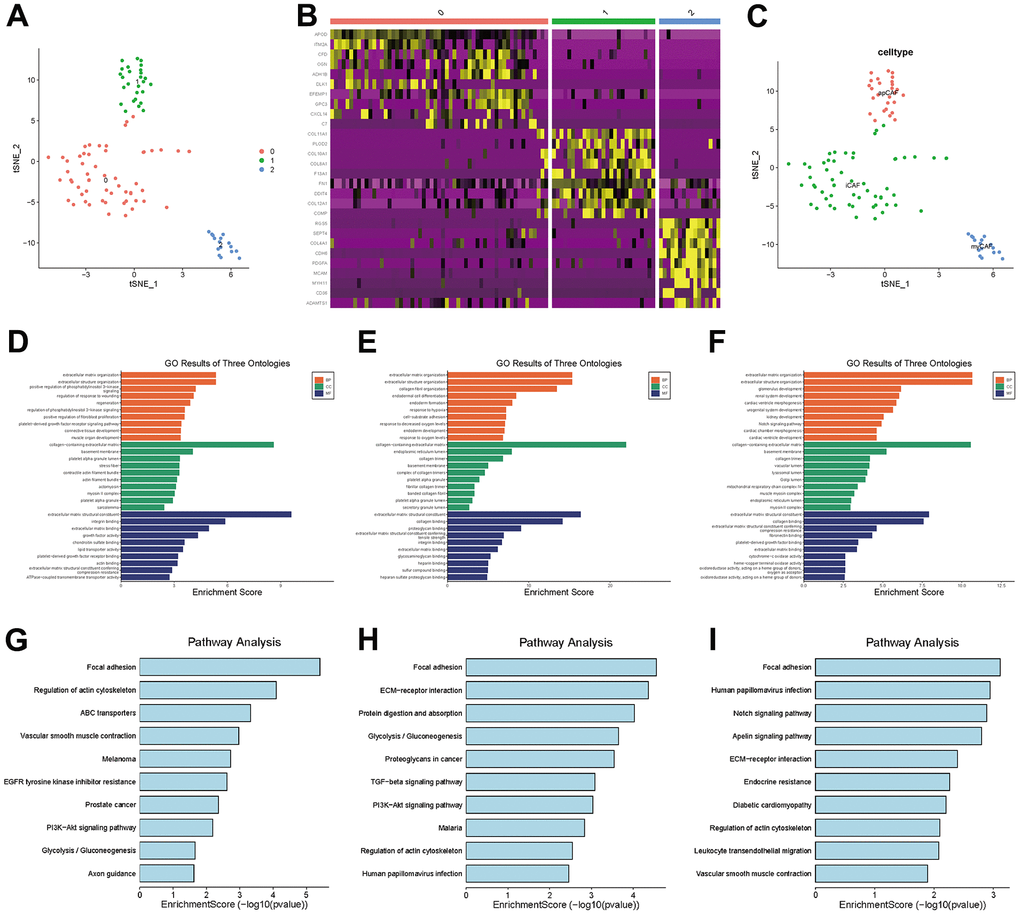
Figure 5.CAF subgroup analysis. (A) Scatter plot of the distribution of clusters in CAFs. (B) Heatmap of the distribution of gene markers in clusters. (C) Type annotation of CAF subgroups. (D) Results of GO analyses of prCAF subgroups. (E) Results of GO analyses of myCAF subgroups. (F) Results of GO analyses of emCAFs. (G) Results of KEGG pathway analyses of prCAF subgroups. (H) Results of KEGG pathway analyses of myCAF subgroups. (I) Results of KEGG pathway analyses of prCAF subgroups.