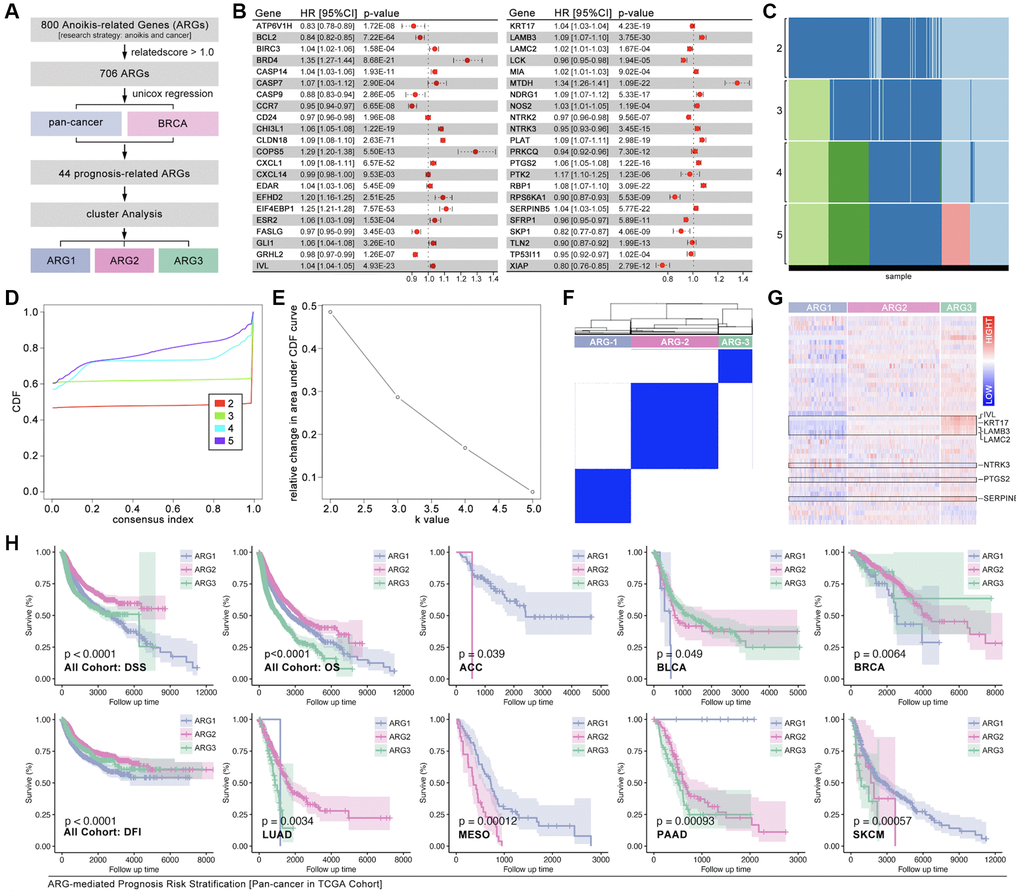
Figure 2.Identification of ARG subgroups and prognosis features. (A) ARG subgroups identification process. (B) The HR of 44 selected ARGs. (C–F) Consensus cluster analysis by ConsensusClusterPlus package to divide the TCGA cohort into three subgroups (ARG1, ARG2, ARG3). (G) 44 ARGs expression features amongst ARG subgroups. (H) Prognosis differences between ARG subgroups in pan-cancer and single type of cancer.