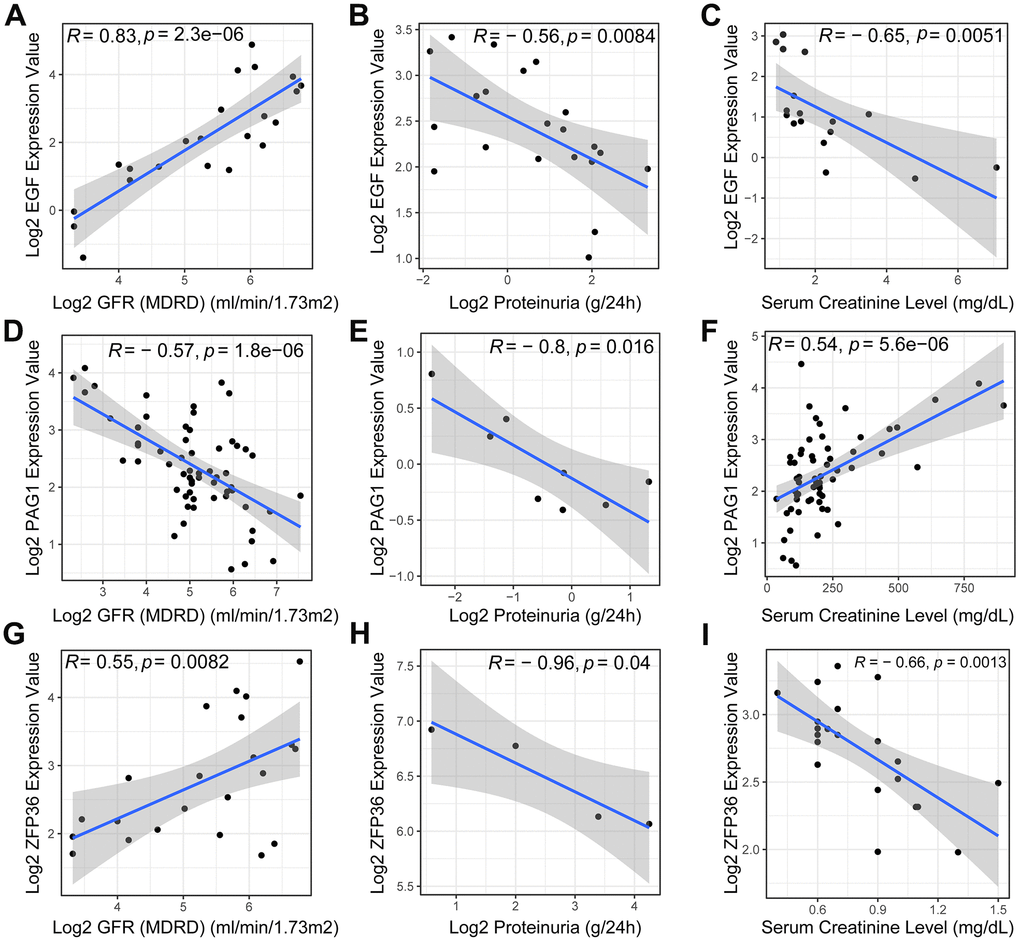
Figure 5.Pearson correlation analysis of necroptosis-related biomarkers and clinical features. The scatter plots revealed a positive correlation between the expression level of the EGF gene (A) in DN patients and the glomerular filtration rate (GFR), while exhibiting a negative correlation with proteinuria (B) and serum creatinine (C). Additionally, the expression level of PAG1 was negatively correlated with GFR (D) and proteinuria (E), but positively correlated with serum creatinine (F). ZFP36, on the other hand, exhibited a positive correlation with GFR (G) but a negative correlation with proteinuria (H) and serum creatinine (I) levels.