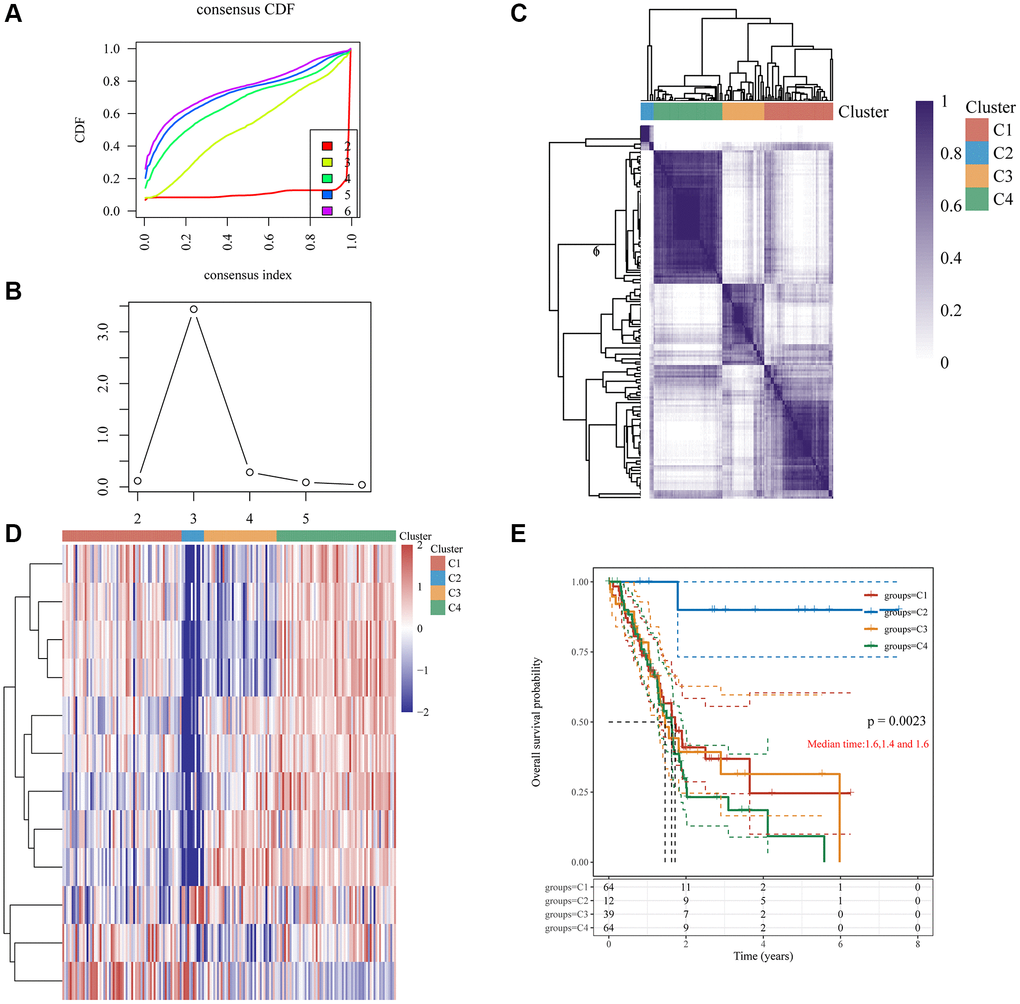
Figure 2.Clustering of PC molecular subgroups based on 12 GRGs. (A) Cumulative distribution function (CDF) curve. (B) CDF delta area curve, which shows how the area under the CDF curve changes between k and k-1 for each category number. The horizontal axis represents the number k, and the vertical axis represents the change in area under the CDF curve; each line represents a relative change. (C) A heatmap representing the consensus matrix for k = 4 derived from consensus clustering. Rows and columns in the matrix represent samples, and the degrees of consistency are represented by white to dark blue. (D) The heatmap of 12 GRGs in 4 clusters. (E) The KM survival curve of different groups in TCGA data sets.