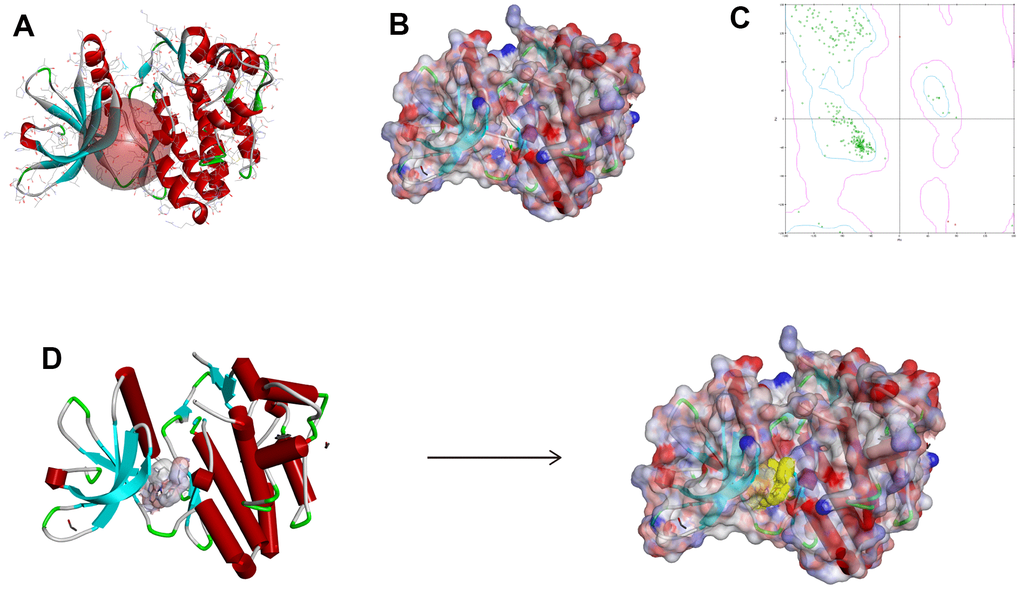
Figure 5.The chemical structure of Janus kinase 3 (JAK3). (A) Initial crystal structure of JAK3 with active binding sphere addition. (B) Macromolecule with surface binding region surrounded, red indicated positive charge and blue indicated negative charge. (C) The Ramachandran chart of JAK3 macromolecule. (D) Docking structure model of FM-381-JAK3 complex.