Aging
Navigate
Back to articleFigure 2(2 of 9)
100%
Figure 2
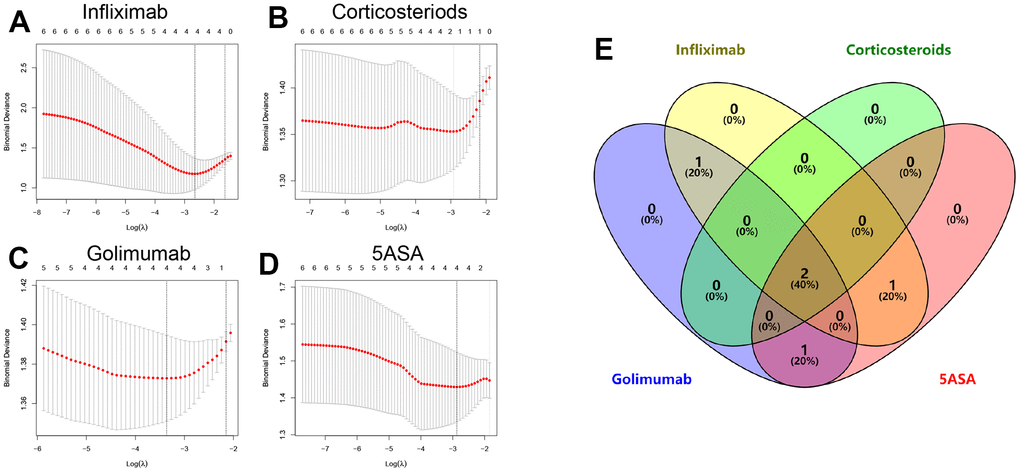
Figure 2.Lasso regression analysis results and partial likelihood deviance for the Lasso regression in infliximab (A), corticosteroids (B), golimumab (C), or 5-ASA (D) treatment cohorts. (E) Venn diagram showing overlapping key genes in Lasso regression.
Figure 2 — Comprehensive analysis reveals key genes and environmental toxin exposures underlying treatment response in ulcerative colitis based on in-silico analysis and Mendelian randomization | Aging