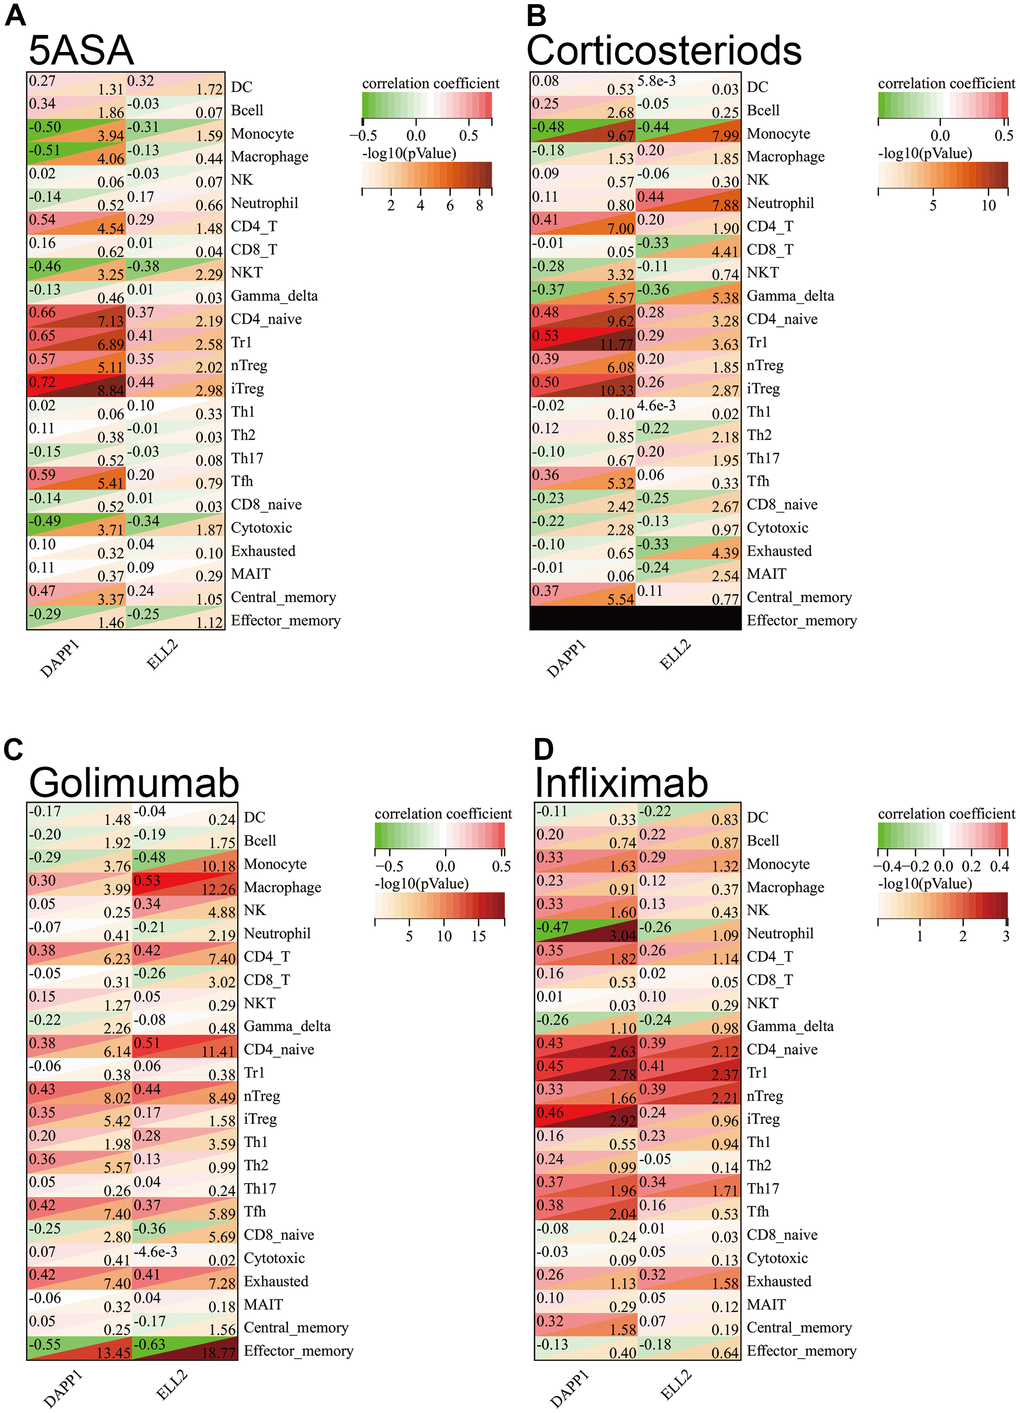
Figure 3.The Spearman correlation analysis demonstrated the correlation between gene expression levels of DAPP1 and ELL2 and the extent of immune cell infiltration in cohorts of UC patients who received 5-ASA (A), corticosteroids (B), golimumab (C), or infliximab (D), respectively.