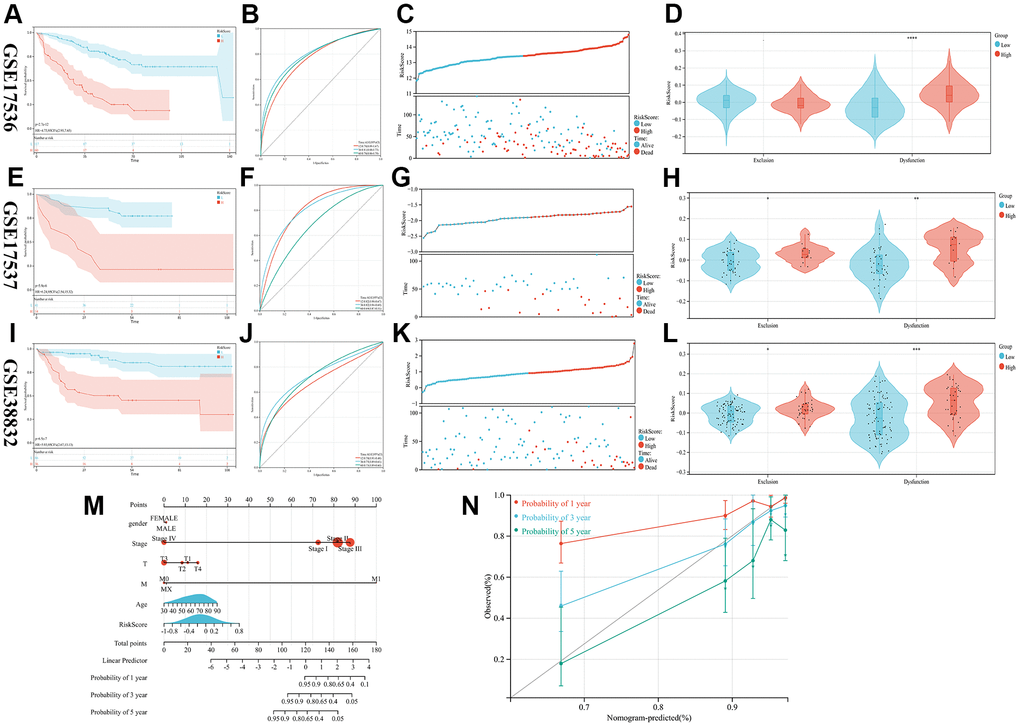
Figure 3.Validation of the prognostic model. (A–L) The KM, ROC, RISKSCORE, and TIDE analysis showing the prognostic value in three cohorts (M) Construction of the nomogram model utilizing RiskScore and other characteristics. (N) A calibration plot compares nomogram-predicted survival rates with observed survival rates.