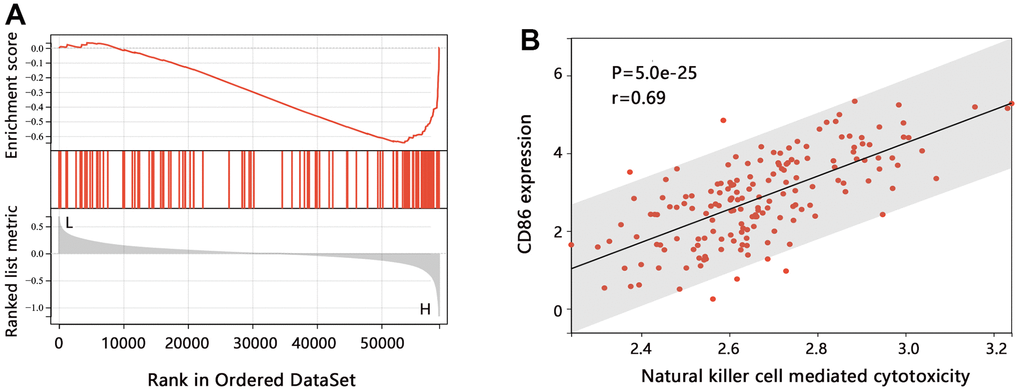
Figure 5.The pathway enrichment analysis in HGG. (A) GSEA analysis on CD86. (B) Relation between the ssGSEA score of each sample and CD86 expression level.
Figure 5 — Integrated analysis reveals the potential of cluster of differentiation 86 as a key biomarker in high-grade glioma | Aging