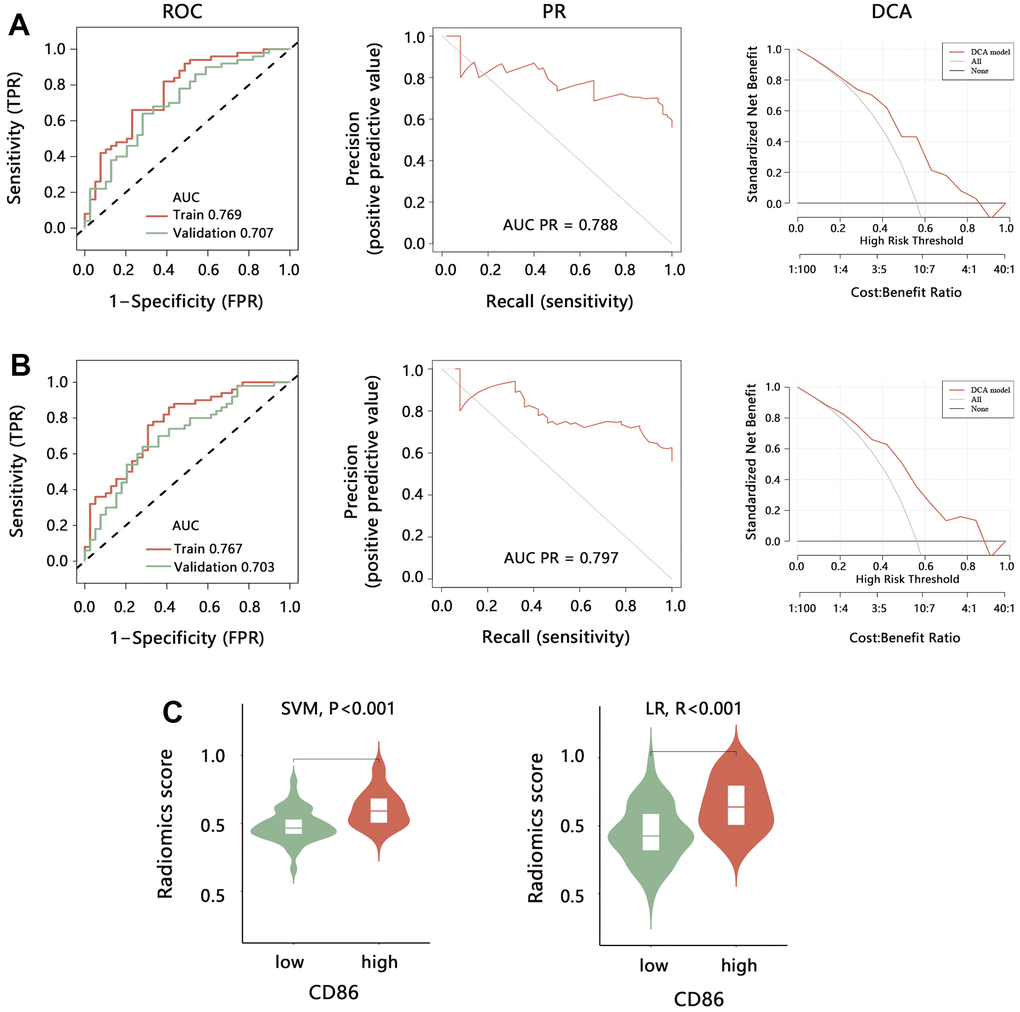
Figure 8.Performance evaluation of radiomics model for predicting the CD86 expression. The ROC, PR, and DCA analyses were performed to evaluate the model performance established by (A) SVM and (B) LR method in training set and validation set. (C) The difference in radiomics score between CD86 high and low expression groups. Abbreviation: SVM, Support Vector Machine; LR, Logistic regression; ROC, receiver operating characteristic curve; PR, precision-recall curve; DCA, decision curve analysis; AUC, area under curve.