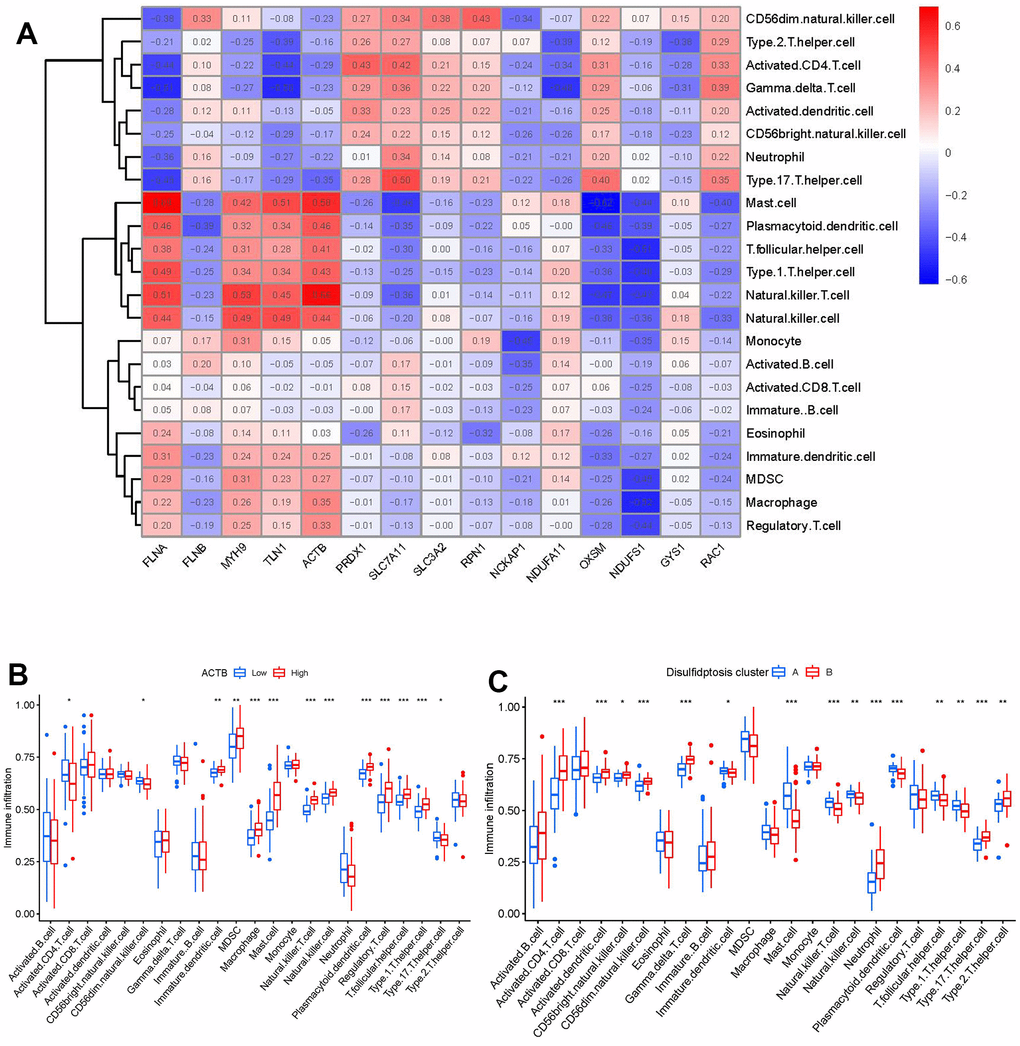
Figure 7.Single sample gene set enrichment analysis. (A) Correlation between immune cell infiltration and the 15 significant disulfidptosis modulators. (B) Difference in the abundance of infiltrating immune cells between high and low ACTB protein expression groups. (C) Differential immune cell infiltration between clusterA and clusterB. *p < 0.05, **p < 0.01, and ***p < 0.001.