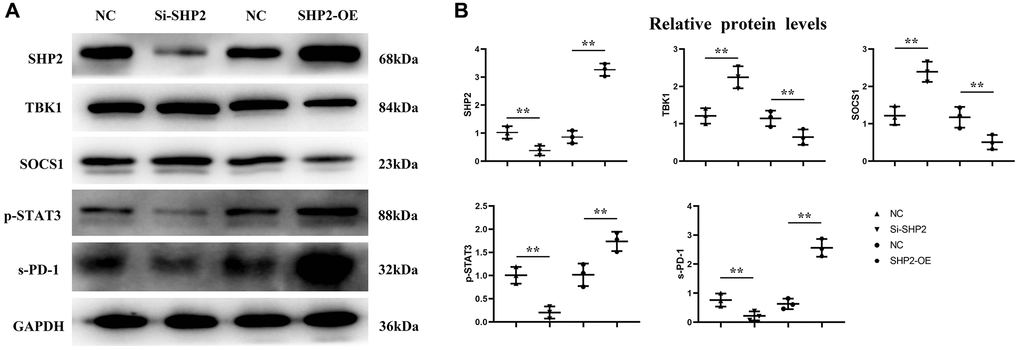
Figure 5.Effect of SHP2 in TAM on p-STAT3, s-PD-1, TBK1 and SOCS1 expression. (A) Western blotting results for SHP2, p-STAT3, s-PD-1, TBK1 and SOCS1; (B) Statistics of relative protein expression levels of SHP2, p-STAT3, s-PD-1, TBK1 and SOCS1. **P < 0.01.