Aging
Navigate
Back to articleFigure 3(3 of 12)
100%
Figure 3
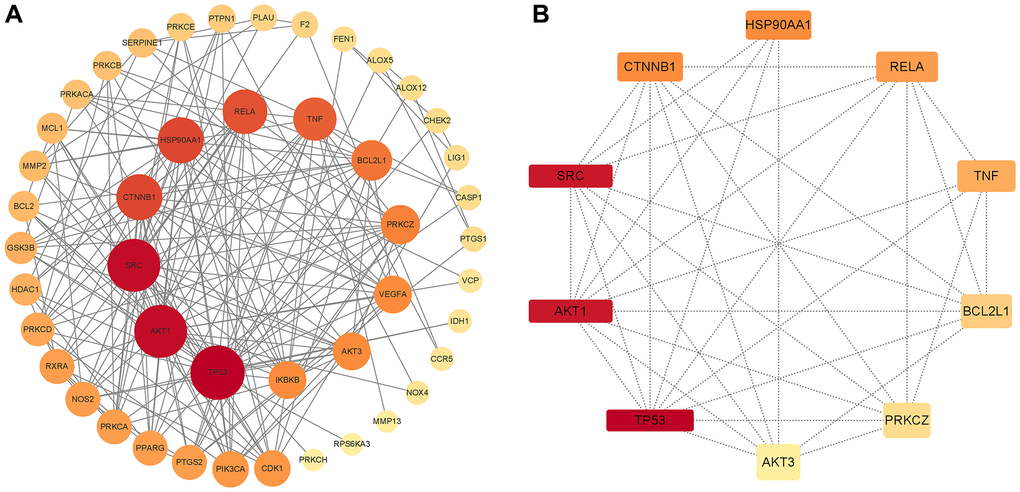
Figure 3.PPI network of common compound–disease targets and hub genes. (A) PPI network of common compound–disease target. (B) The hub 10 genes. The size and color of nodes indicate the magnitude of the degree. A larger size of a node means a larger degree.
Figure 3 — Exploring the effect and mechanism of Aloin A against cancer cachexia-induced muscle atrophy via network pharmacology, molecular docking, molecular dynamics and experimental validation | Aging