Submit an Article
Navigate
Home
Editorial Board
Editorial Policies
Current Volume
Archive
Scientific Integrity
Publication Ethics Statements
Interviews with Outstanding Authors
Newsroom
Sponsored Conferences
Podcast
Contact
Special Collections
Submit an Article
Online ISSN: 1945-4589
Research Paper
|
Volume 15, Issue 24
|
pp. 15599–15623
Unravelling diagnostic clusters and immune landscapes of cuproptosis patterns in intervertebral disc degeneration through dry and wet experiments
Back to article
Figure 1
(1 of 12)
−
100%
+
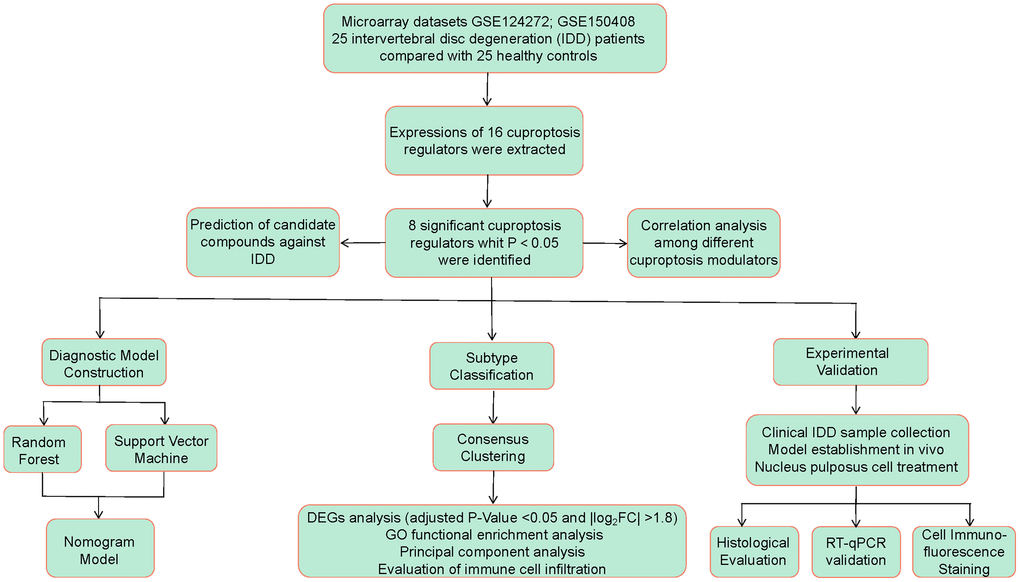
Figure 1.
Flow chart of the study design.
Figure 1 — Unravelling diagnostic clusters and immune landscapes of cuproptosis patterns in intervertebral disc degeneration through dry and wet experiments | Aging