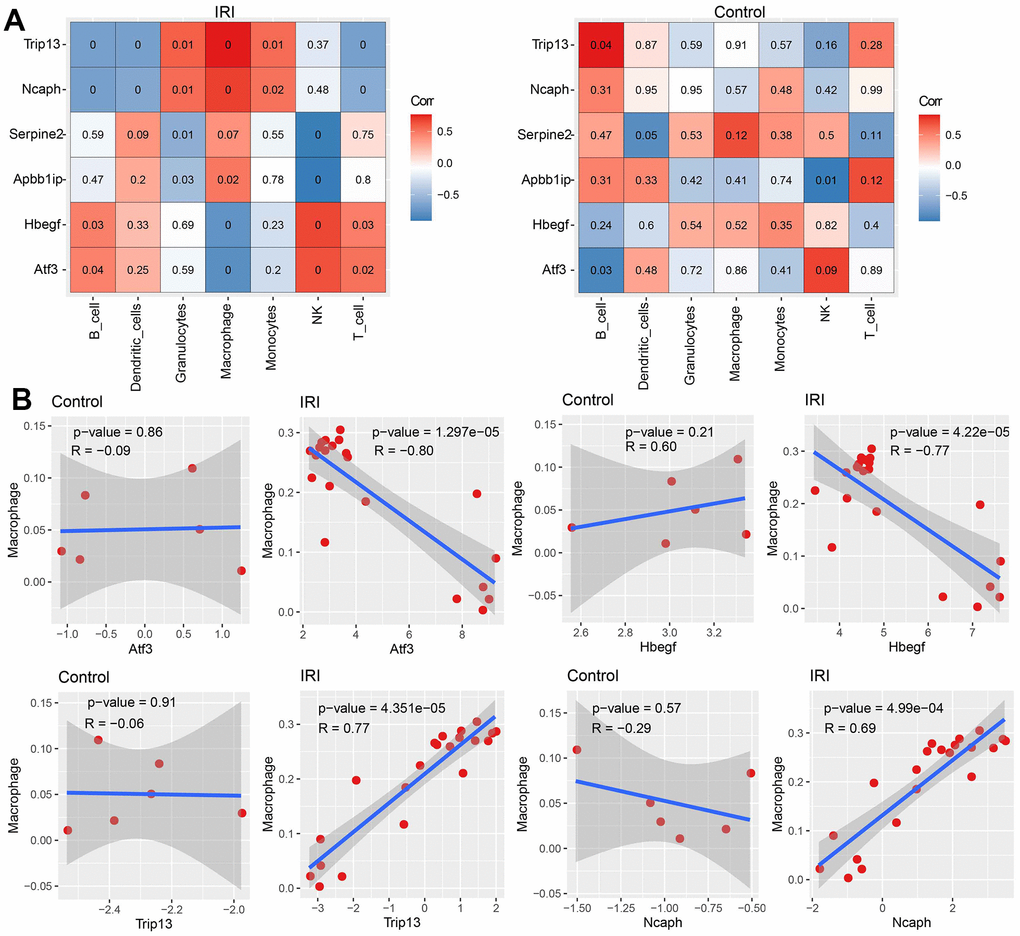
Figure 7.The correlation between immune cell abundance and hub genes expression. (A) The correlation between immune cell abundance and hub genes expression in IRI and control groups. (B) The correlation between macrophage abundance and each hub gene expression in each group.