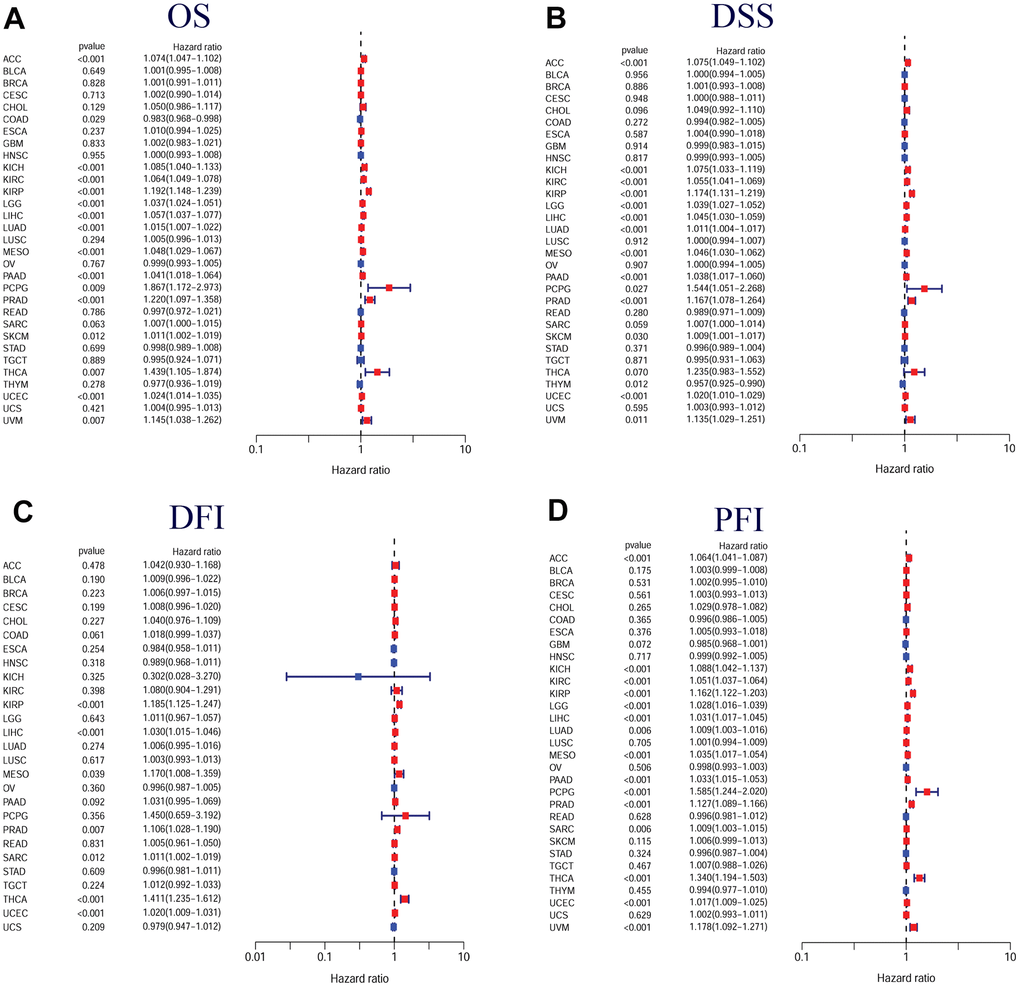
Figure 7.Forest plots of in pan-cancer from the TCGA database. (A) Relationship between TPX2 expression and OS; (B) Relationship between TPX2 expression and DSS; (C) Relationship between TPX2 expression and DFI; (D) Relationship between TPX2 expression and PFI. p-value < 0.05 was considered statistically significant.