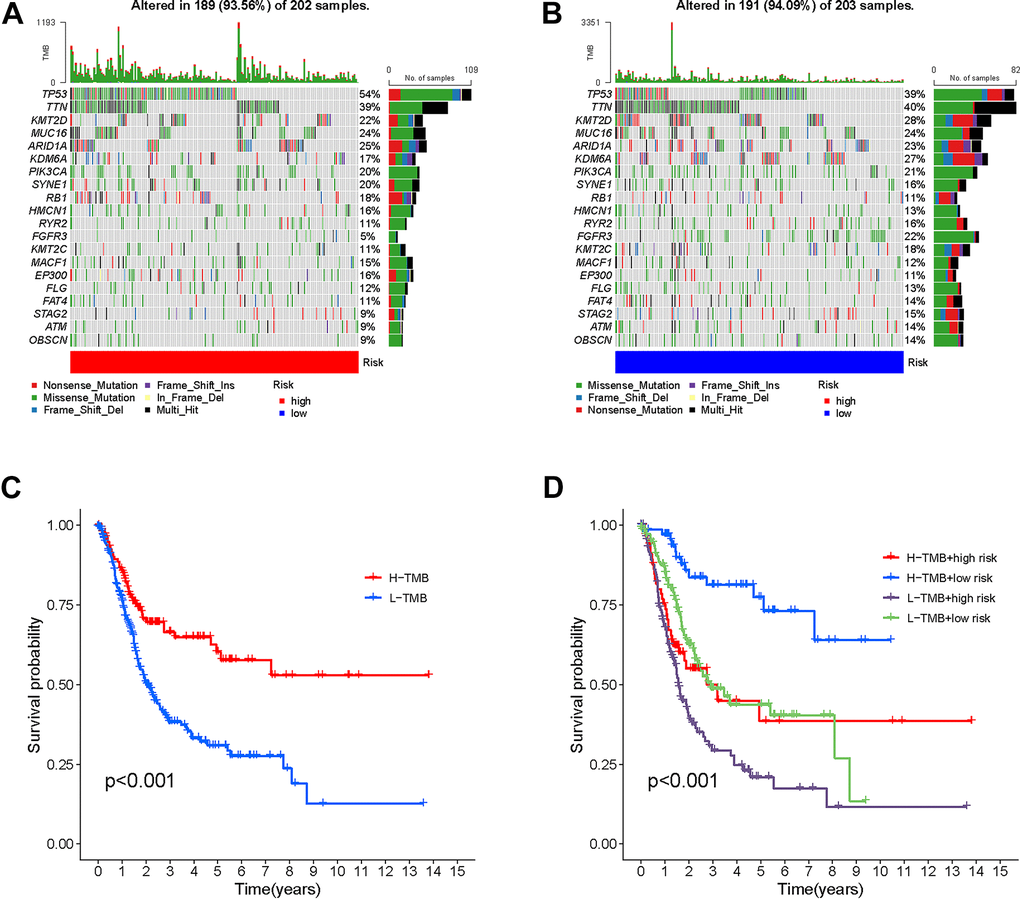
Figure 9.Correlation between risk score and TMB. High risk score. High-risk score (A) and low-risk score (B) were shown in the established oncoPrint. (C) High TMB and low TMB groups were shown in the Kaplan-Meier curve. (D) Kaplan-Meier curve stratification based on TMB and risk signature.