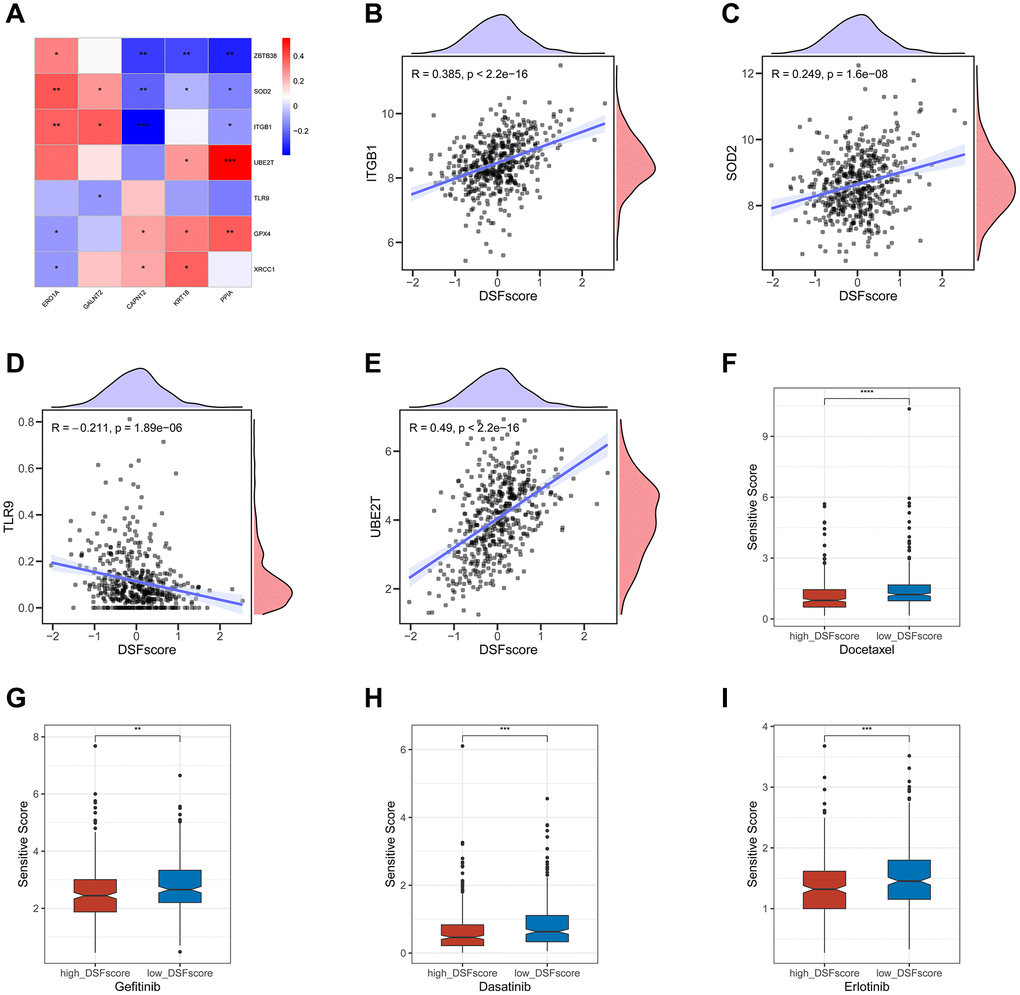
Figure 8.Correlations of the DRG score with CRSGs and chemotherapeutic sensitivity in LUAD. (A) Correlations between the expression of CRSGs and five genes in the DRG prognostic model. (B–E) Correlations between the expression of CRSGs and the DRG score. (F–I) Difference in chemotherapeutic sensitivity between high- and low-risk groups. *P < 0.05, **P < 0.01, ***P < 0.001, ****P < 0.0001.