Submit an Article
Navigate
Home
Editorial Board
Editorial Policies
Current Volume
Archive
Scientific Integrity
Publication Ethics Statements
Interviews with Outstanding Authors
Newsroom
Sponsored Conferences
Podcast
Contact
Special Collections
Submit an Article
Online ISSN: 1945-4589
Research Paper
|
Volume 16, Issue 4
|
pp. 3160–3184
Single-cell and bulk RNA sequencing data jointly reveals
VDAC2’
s impacts on prognosis and immune landscape of NSCLC
Back to article
Figure 3
(3 of 8)
−
100%
+
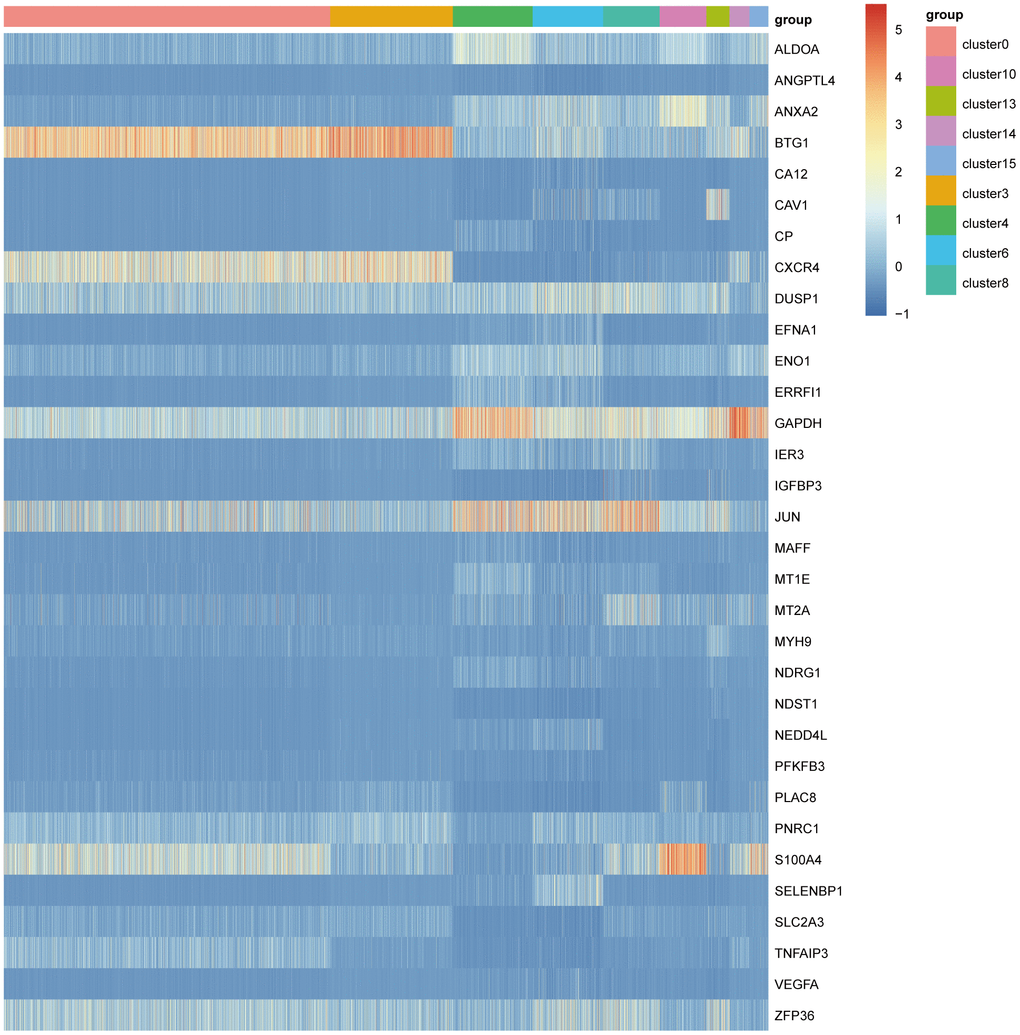
Figure 3.
The heatmap of differential expression of hypoxia related marker genes in all cell clusters.