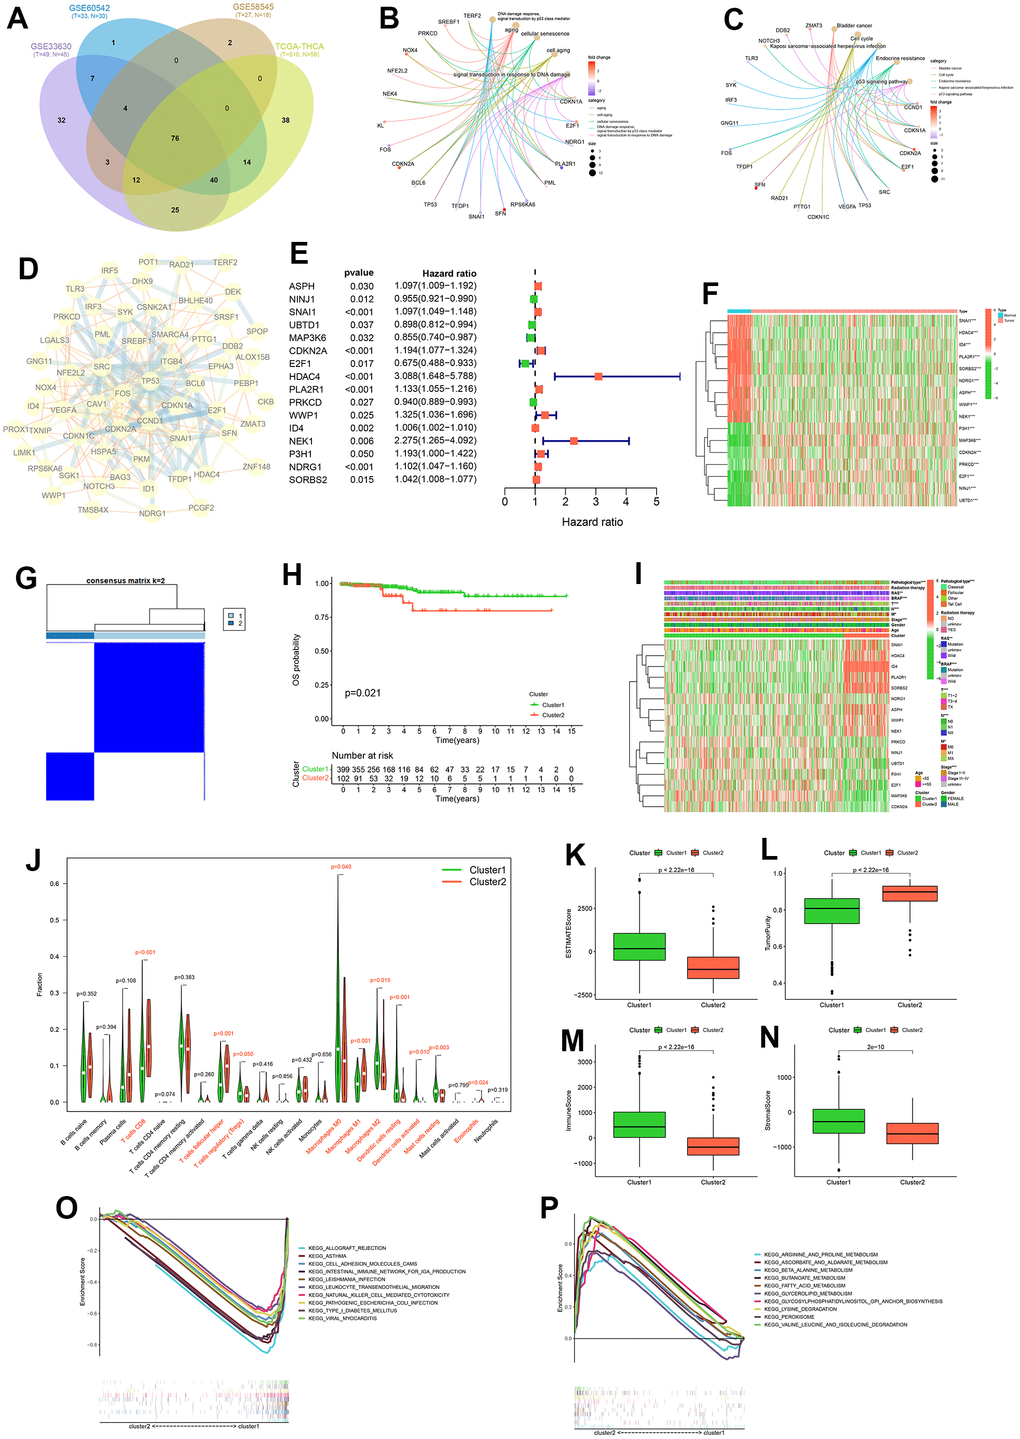
Figure 3.Consensus cluster analysis. Intersection of differentially expressed cellular senescence genes across four cohorts (A). GO functional enrichment analysis (B) and KEGG pathway enrichment analysis (C) of 76 intersecting genes. Protein-Protein interactions (PPI) network diagram of 76 intersecting genes (D). Forest plot of prognostic genes among 76 intersecting genes (E). Expression heatmap of prognostic genes (F). Consensus clustering matrix for k = 2 (G). K-M curve of OS probability between cluster1 and cluster2 (H). Heatmap of clinicopathological feature correlations between cluster1 and cluster2 (I). Violin plots of the infiltration of immune cells in cluster1 and cluster2 by CIBERSORT algorithm (J). Boxplot of ESTIMATEScore (K), TumorPurity (L), ImmuneScore (M) and StromalScore (N) on cluster1 and cluster2 by ESTIMATE algorithm. KEGG pathway enrichment analysis in cluster1 (O) and cluster2 (P).