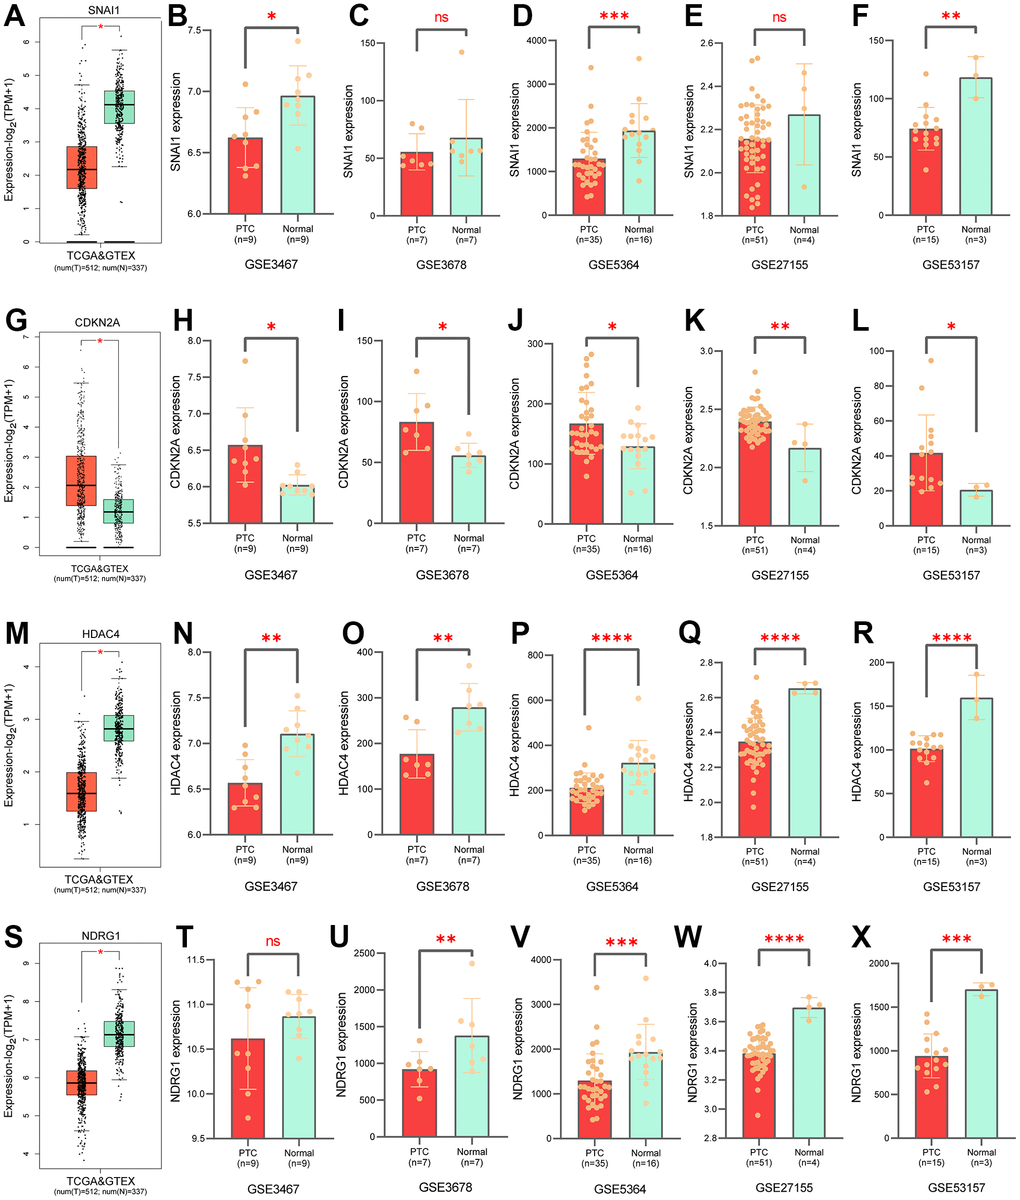
Figure 5.Validation of gene expression levels in prognostic models. Expression of SNAI1 in GTEx (A), in GSE3467 (B), in GSE3678 (C), in GSE5364 (D), in GSE27155 (E), in GSE35157 (F). Expression of CDKN2A in GTEx (G), in GSE3467 (H), in GSE3678 (I), in GSE5364 (J), in GSE27155 (K), in GSE35157 (L). Expression of HDAC4 in GTEx (M), in GSE3467 (N), in GSE3678 (O), in GSE5364 (P), in GSE27155 (Q), in GSE35157 (R). Expression of NDRG1 in GTEx (S), in GSE3467 (T), in GSE3678 (U), in GSE5364 (V), in GSE27155 (W), in GSE35157 (X).