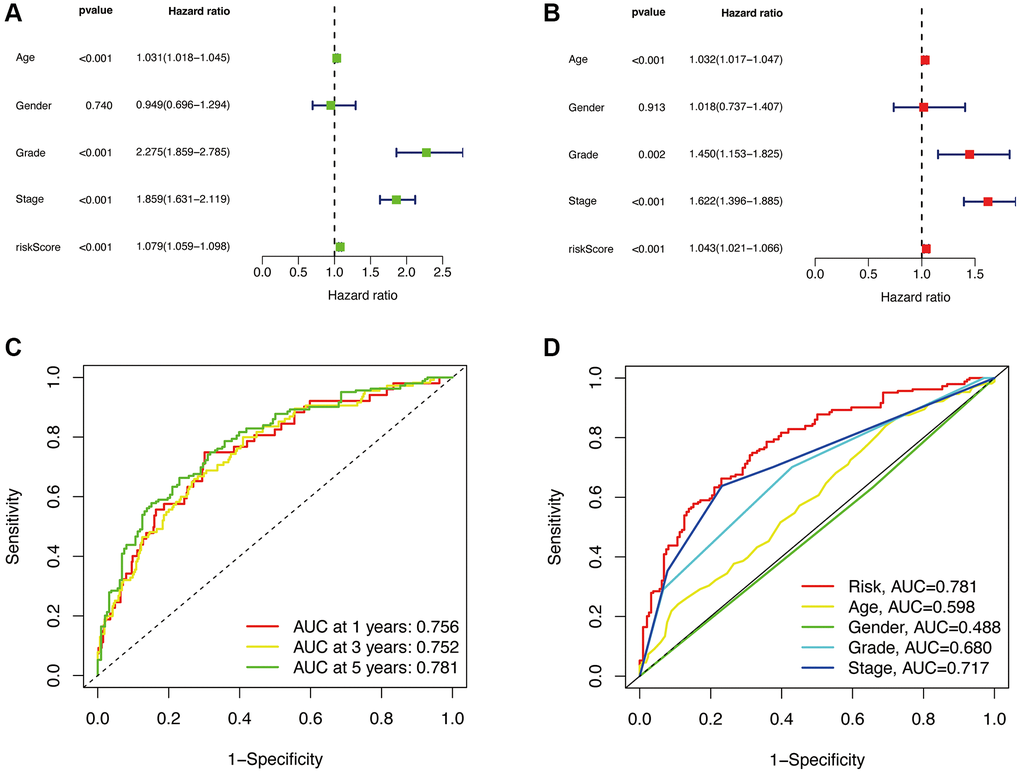
Figure 5.Independent prognostic analysis. Univariate analysis (A). Multivariate analysis (B). The ROC curve of the risk model for 1, 3, and 5 years (C). The 5-year ROC curve of the risk model in relation to other clinical characteristics (D).
Figure 5 — Disulfideptosis-associated lncRNAs reveal features of prognostic, immune escape, tumor mutation, and tumor malignant progression in renal clear cell carcinoma | Aging