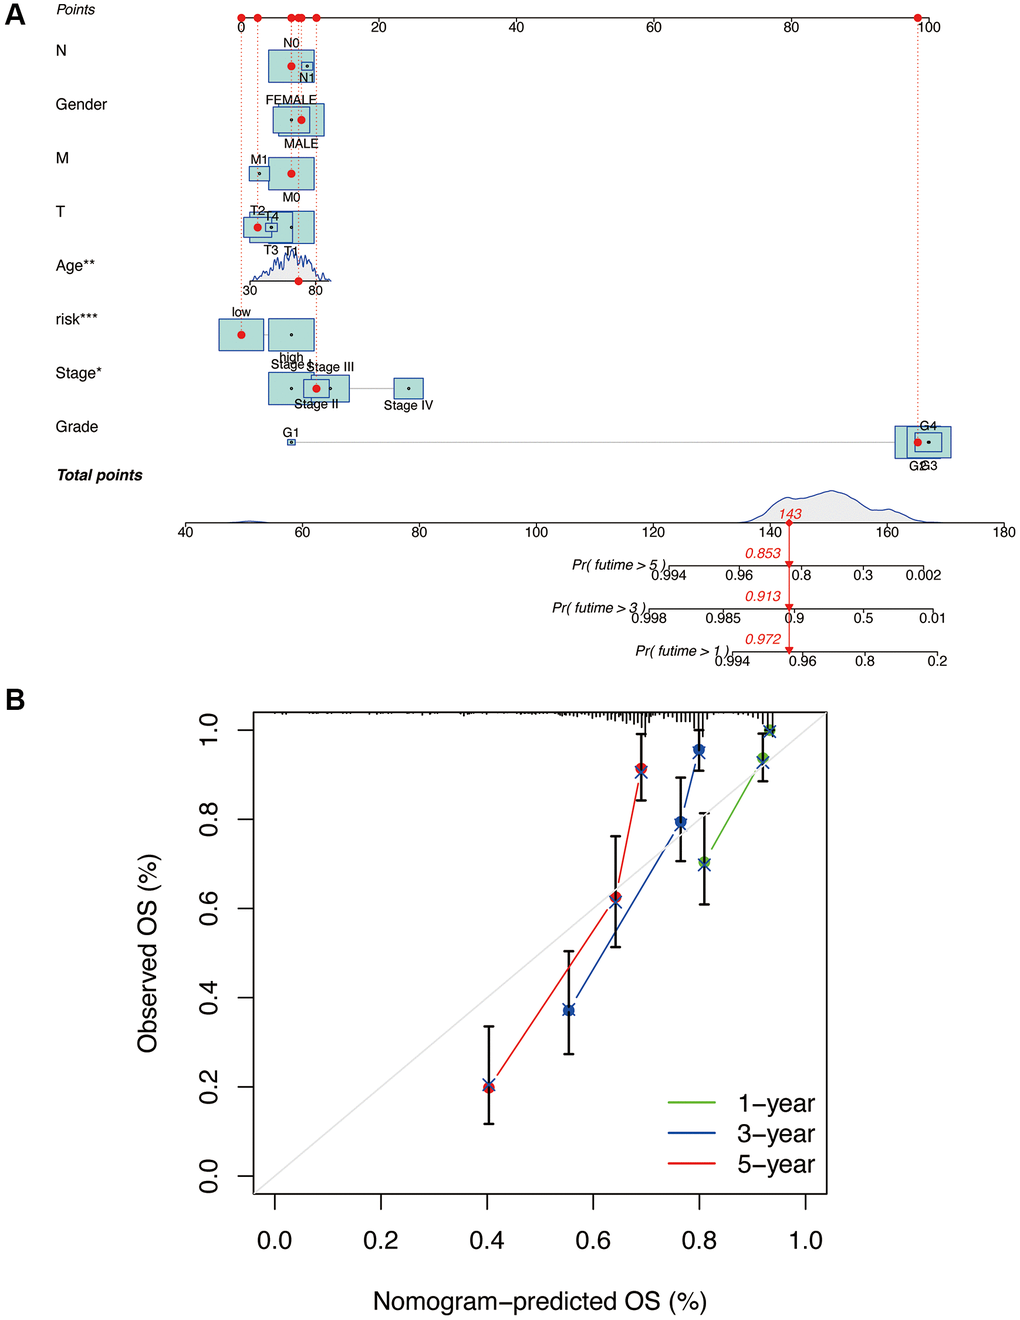
Figure 7.Construction and validation of nomogram column line plots constructed from risk models. A nomogram integrates risk scores and clinical characteristics to predict overall survival at 1, 3, and 5 years (A). Calibration curves for overall survival at 1, 3, and 5 years (B). *p < 0.05, **p < 0.01, ***p < 0.001.