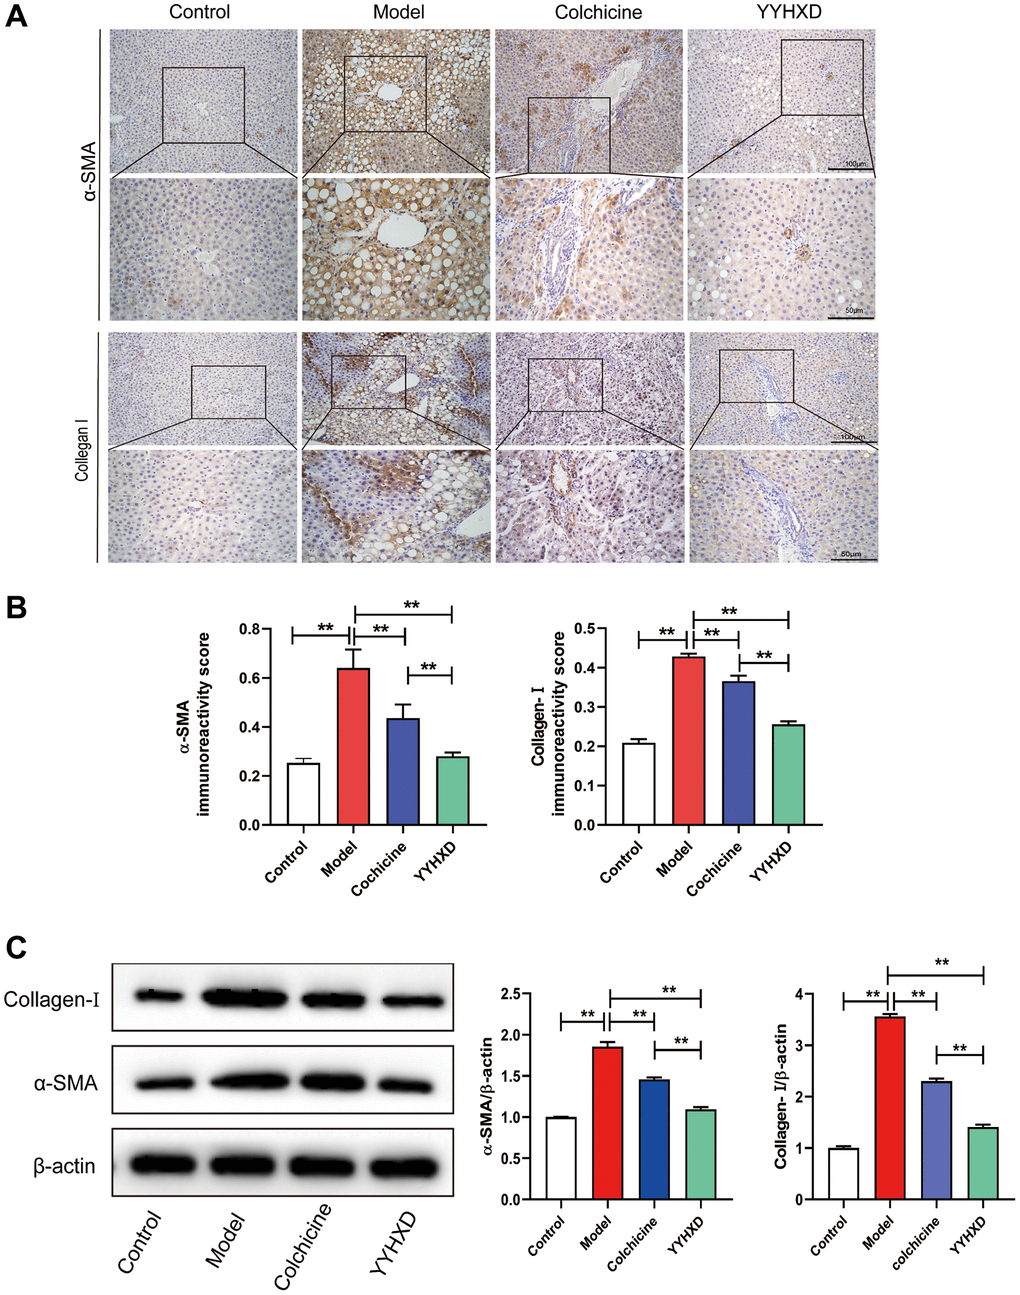
Figure 3.(A) a-SMA and collagen I expression in liver tissue were detected to investigate liver fibrosis. (A, B) Immunohistochemical images showed a-SMA and collagen I positive localization and positive expression rate. **P < 0.01 compared with the model group. (C) Western blot image showing a-SMA and collagen I expression in liver tissues. **P < 0.01 compared with the model group.