Submit an Article
Navigate
Home
Editorial Board
Editorial Policies
Current Volume
Archive
Scientific Integrity
Publication Ethics Statements
Interviews with Outstanding Authors
Newsroom
Sponsored Conferences
Podcast
Contact
Special Collections
Submit an Article
Online ISSN: 1945-4589
Research Paper
|
Volume 16, Issue 4
|
pp. 3823–3836
Development and validation of a nomogram for predicting the impact of tumor size on cancer-specific survival of locally advanced renal cell carcinoma: a SEER-based study
Back to article
Figure 6
(6 of 7)
−
100%
+
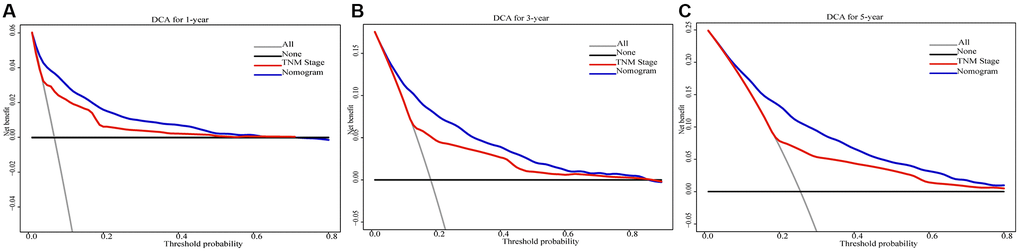
Figure 6.
Decision curve analysis of the 1-, 3-, and 5-year CSS nomogram compared with that of AJCC 8th edition TNM stage in the validation cohort (
A
–
C
).