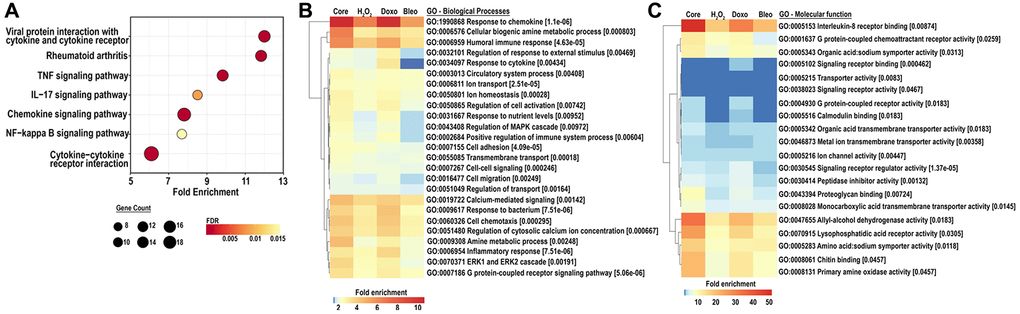
Figure 4.(A) KEGG analysis for the top 25 most enriched pathways in the core senescent profile (FDR ≤0.01). Gene counts represent the number of differentially expressed genes, color scales represent the FDR, and fold enrichment is plotted on the x-axis. (B, C) GO analyses for biological processes and molecular function enriched in the colon fibroblast core senescent profile (FDR <0.01). The top 25 entries are represented after removing redundant processes and functions.