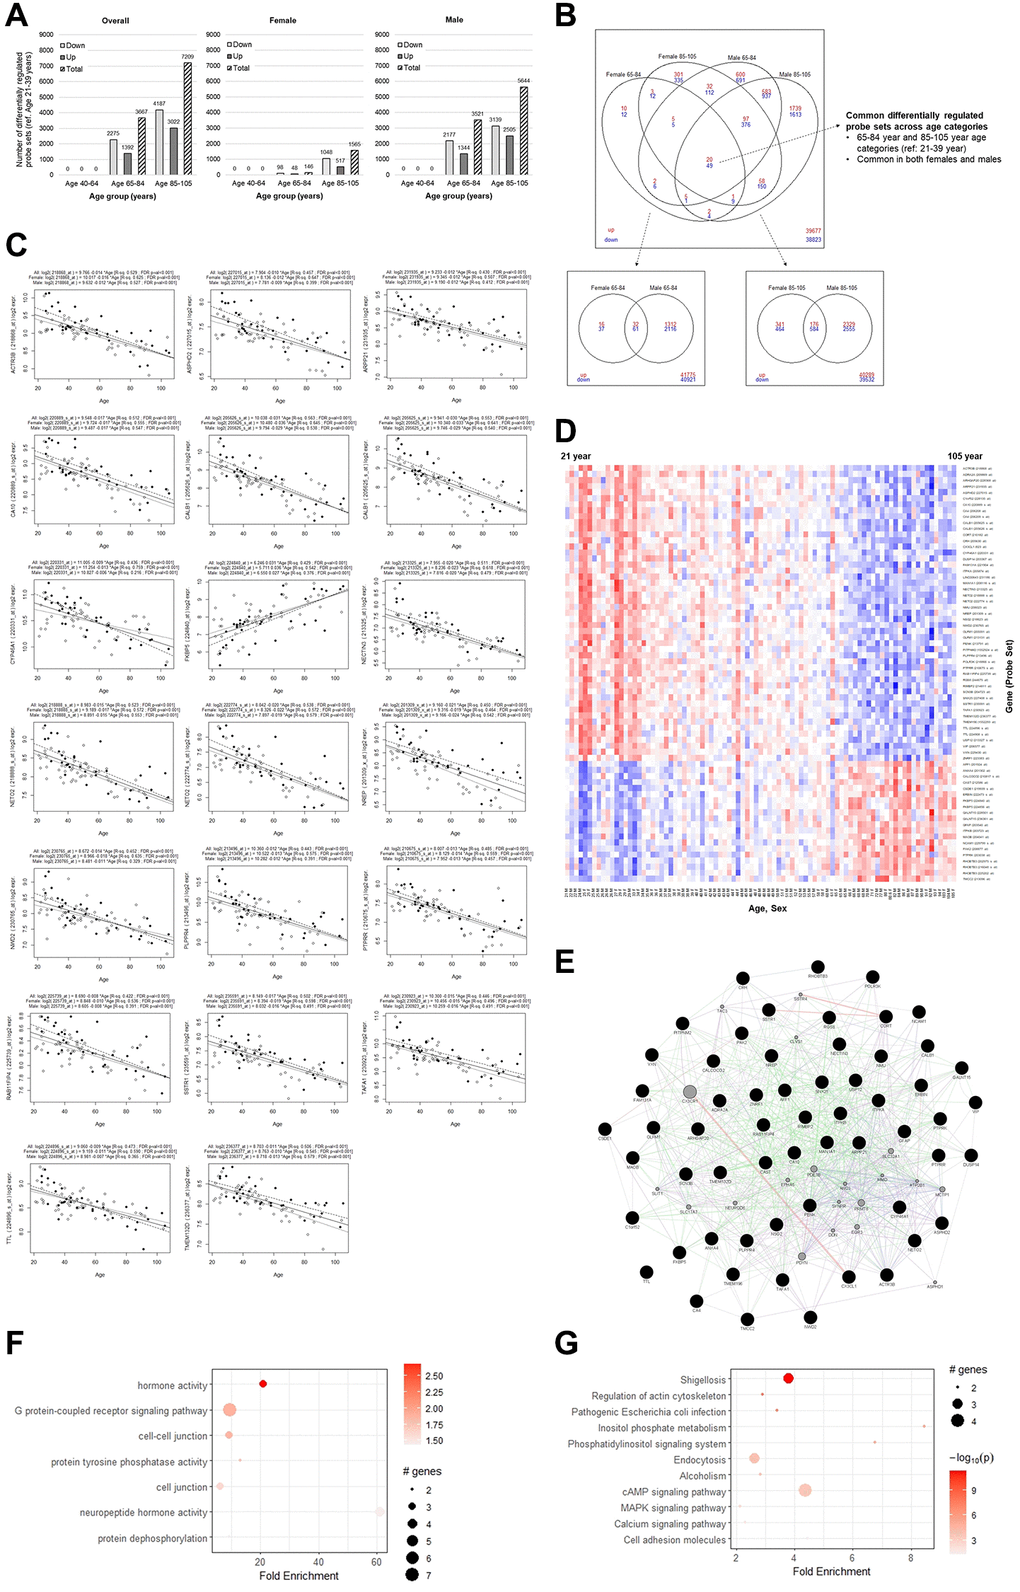
Figure 1.Differential gene expression analysis overall and by sex. (A) The number of probe sets with at least 1.2-fold difference and FDR-adjusted p-value < 0.05 to the reference young category. (B) Overlaps of differentially regulated transcripts between females and males for the old and elderly categories. (C) Univariate linear regression plots of the top 20 common differentially regulated transcripts, overall and stratified by sex. (D) Heatmap plot showing log2 expression level change of the 69 common probe sets across age. (E) Gene network plot, with the genes corresponding to the common transcripts represented by black filled nodes and interconnected genes in gray. Green edges indicate genetic interactions, purple edges indicate co-expression, blue edges indicate co-localization, and red edges indicate physical interactions. (F) GO terms (combined all, BP, MF, CC), and (G) KEGG pathway enrichment analysis.