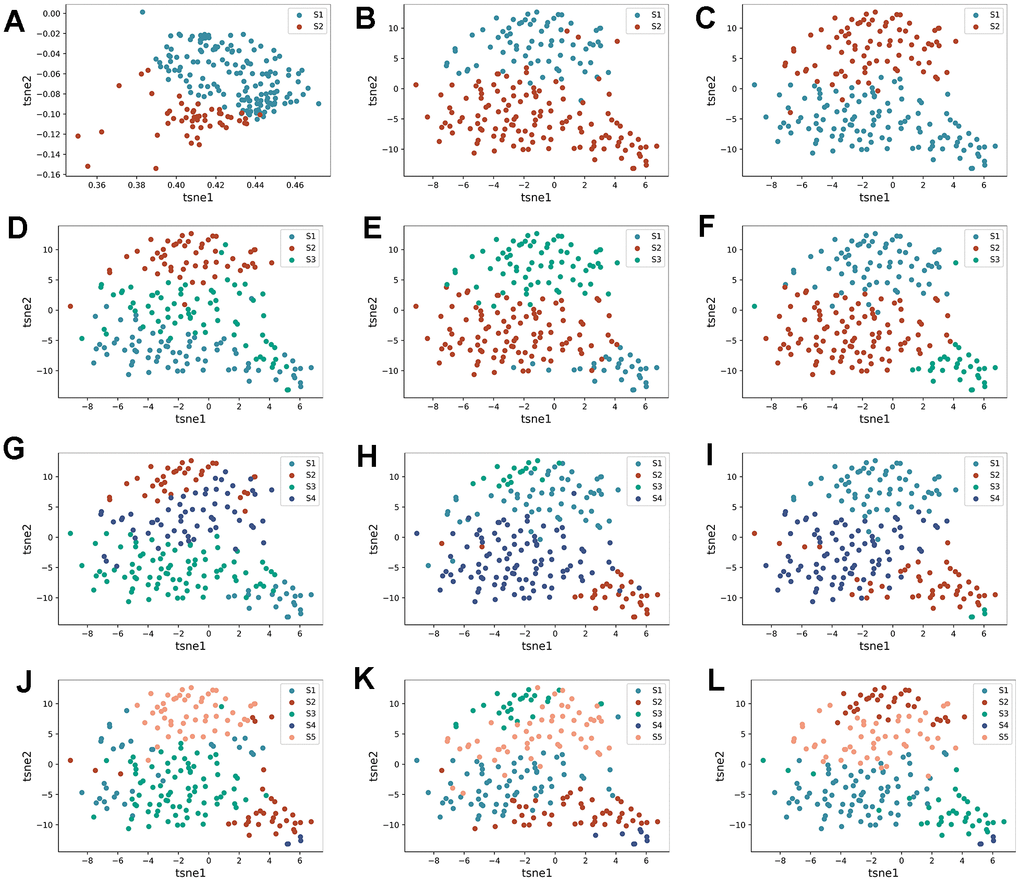
Figure 3.Identification process of HF subtypes. (A–C) are the tsne dimensionality reduction scatter plot obtained by AE, DAE, and K-means algorithms when the number of clusters is set to two categories, respectively. (D–F) are the tsne dimension reduction scatter plot obtained by three algorithms when the number of clusters is set to three categories, respectively. (G–I) are the tsne dimension reduction scatter plot obtained by three algorithms when the number of clusters is set to four categories, respectively. (J–L) are the tsne dimension reduction scatter plot obtained by three algorithms when the number of clusters is set to five categories, respectively.