Submit an Article
Navigate
Home
Editorial Board
Editorial Policies
Current Volume
Archive
Scientific Integrity
Publication Ethics Statements
Interviews with Outstanding Authors
Newsroom
Sponsored Conferences
Podcast
Contact
Special Collections
Submit an Article
Online ISSN: 1945-4589
Research Paper
|
Volume 16, Issue 5
|
pp. 4684–4698
Genetically determined telomere length as a risk factor for hematological malignancies: evidence from Mendelian randomization analysis
Back to article
Figure 2
(2 of 4)
−
100%
+
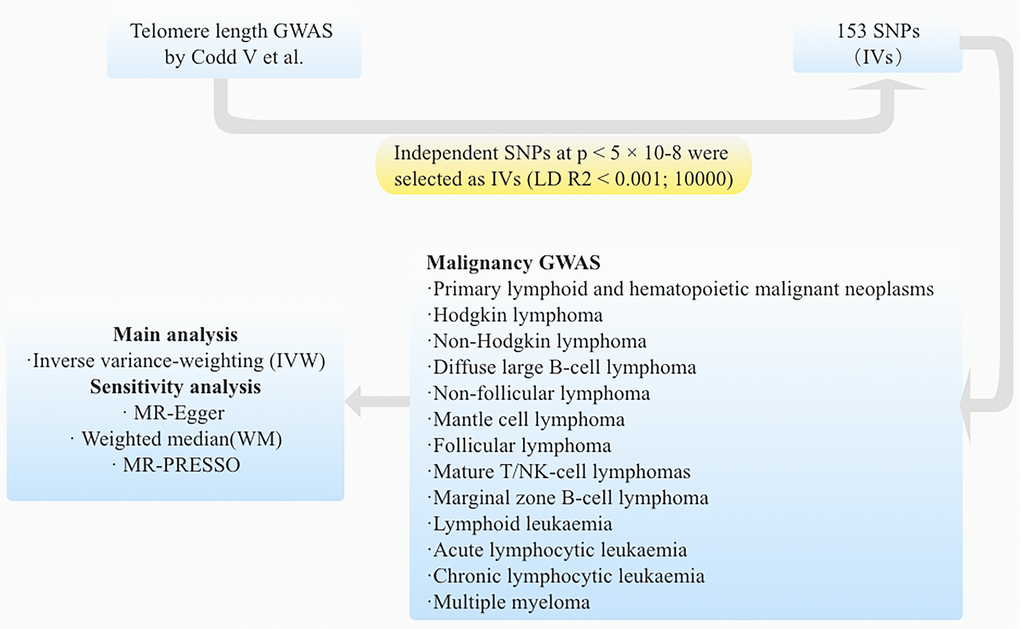
Figure 2.
The flow diagram illustrates the sequential process of the MR study.