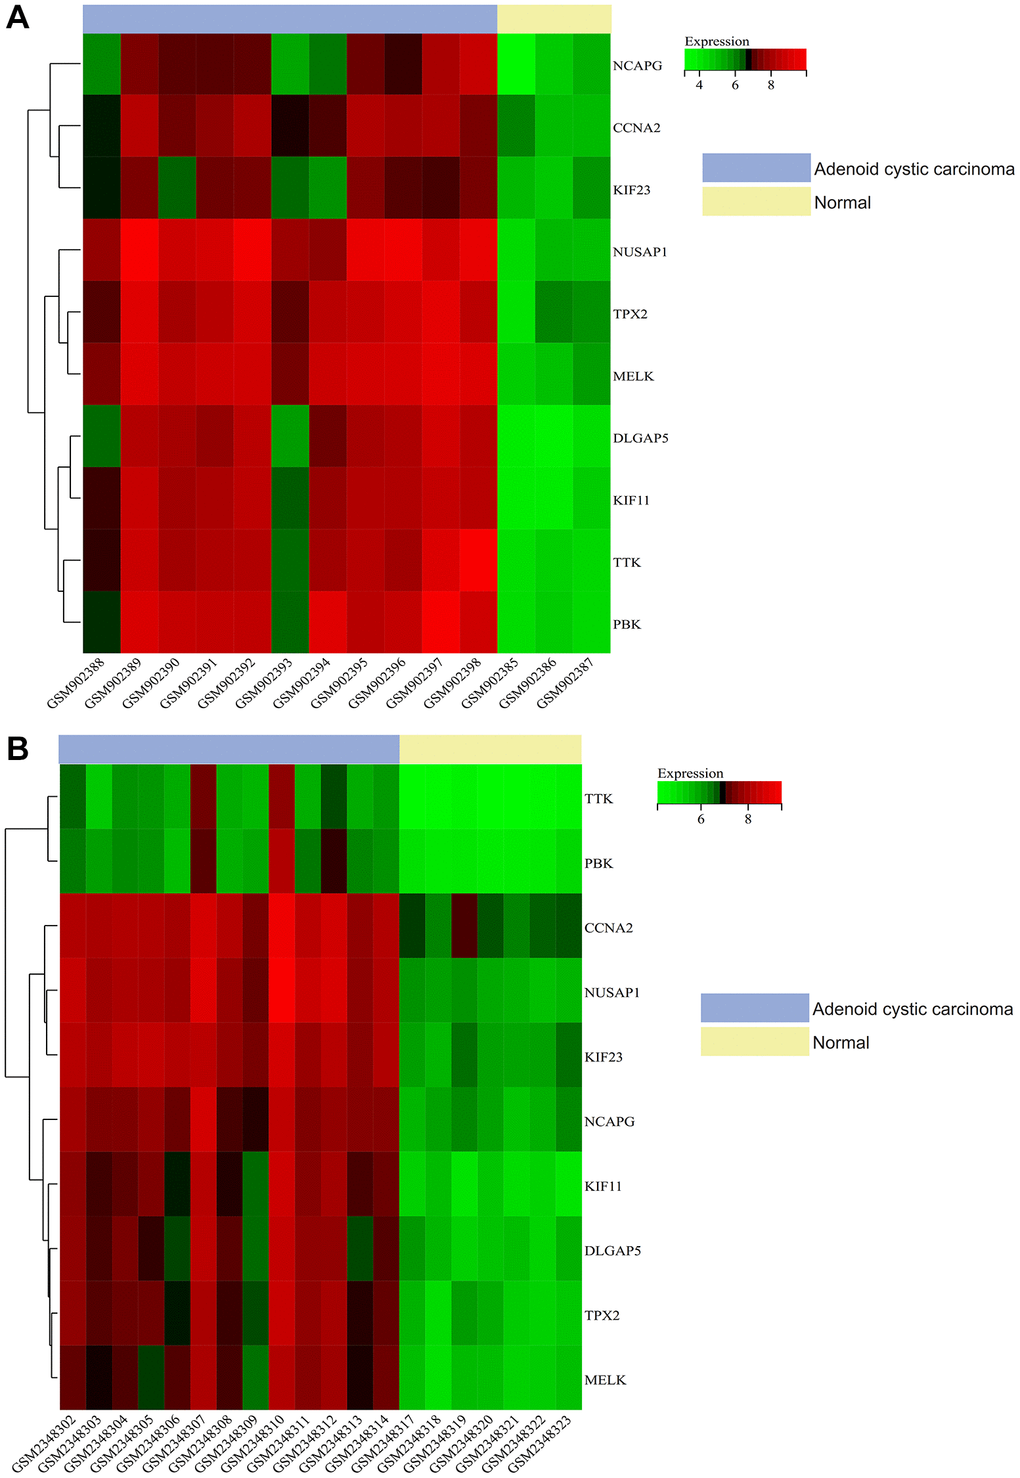
Figure 10.Gene expression heat map. The heat map of the expression of core genes in the samples. (A) The result of GSE36820. (B) The result of GSE88804.
Figure 10 — CCNA2 and KIF23 are molecular targets for the prognosis of adenoid cystic carcinoma | Aging