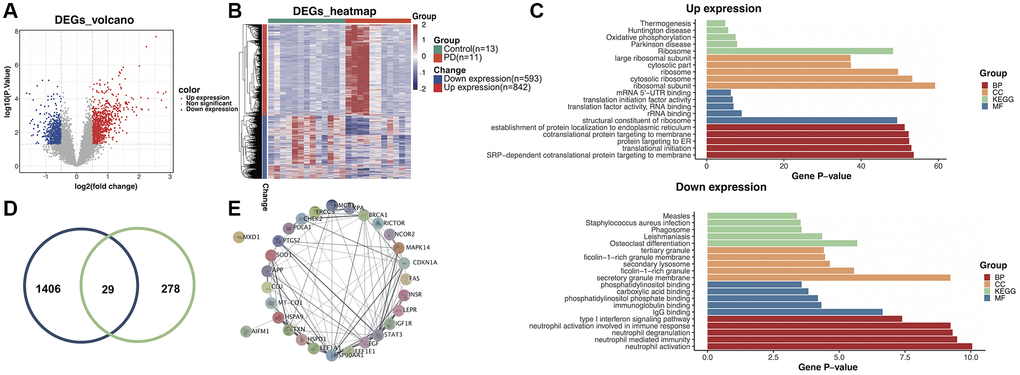
Figure 1.Identification of aging-related differentially expressed genes (DEGs) in the training dataset. (A) Volcano plot of the DEGs. (B) Heatmap of the DEGs. (C) Gene ontology and Kyoto Encyclopedia of Genes and Genomes (KEGG) enrichment analysis of overexpressed and underexpressed DEGs. (D) Intersection of aging-related genes and DEGs. (E) Protein-protein interaction (PPI) network analysis reveals that 28 genes interact with each other.