Submit an Article
Navigate
Home
Editorial Board
Editorial Policies
Current Volume
Archive
Scientific Integrity
Publication Ethics Statements
Interviews with Outstanding Authors
Newsroom
Sponsored Conferences
Podcast
Contact
Special Collections
Submit an Article
Online ISSN: 1945-4589
Research Paper
|
Volume 16, Issue 16
|
pp. 11824–11842
Identifying novel circadian rhythm biomarkers for diagnosis and prognosis of melanoma by an integrated bioinformatics and machine learning approach
Back to article
Figure 6
(6 of 8)
−
100%
+
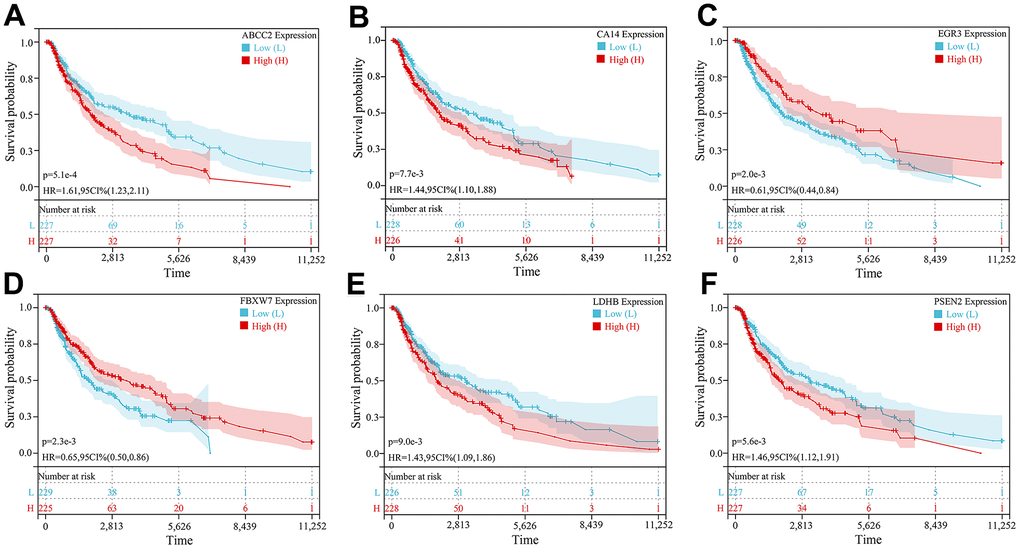
Figure 6.
Kaplan-Meier survival curve analysis of 6 key CRGs.
(
A
–
F
) Kaplan-Meier survival curves of (
A
) ABCC2, (
B
) CA14, (
C
) EGR3, (
D
) FBXW7, (
E
) LDHB, and (
F
) PSEN2, respectively.