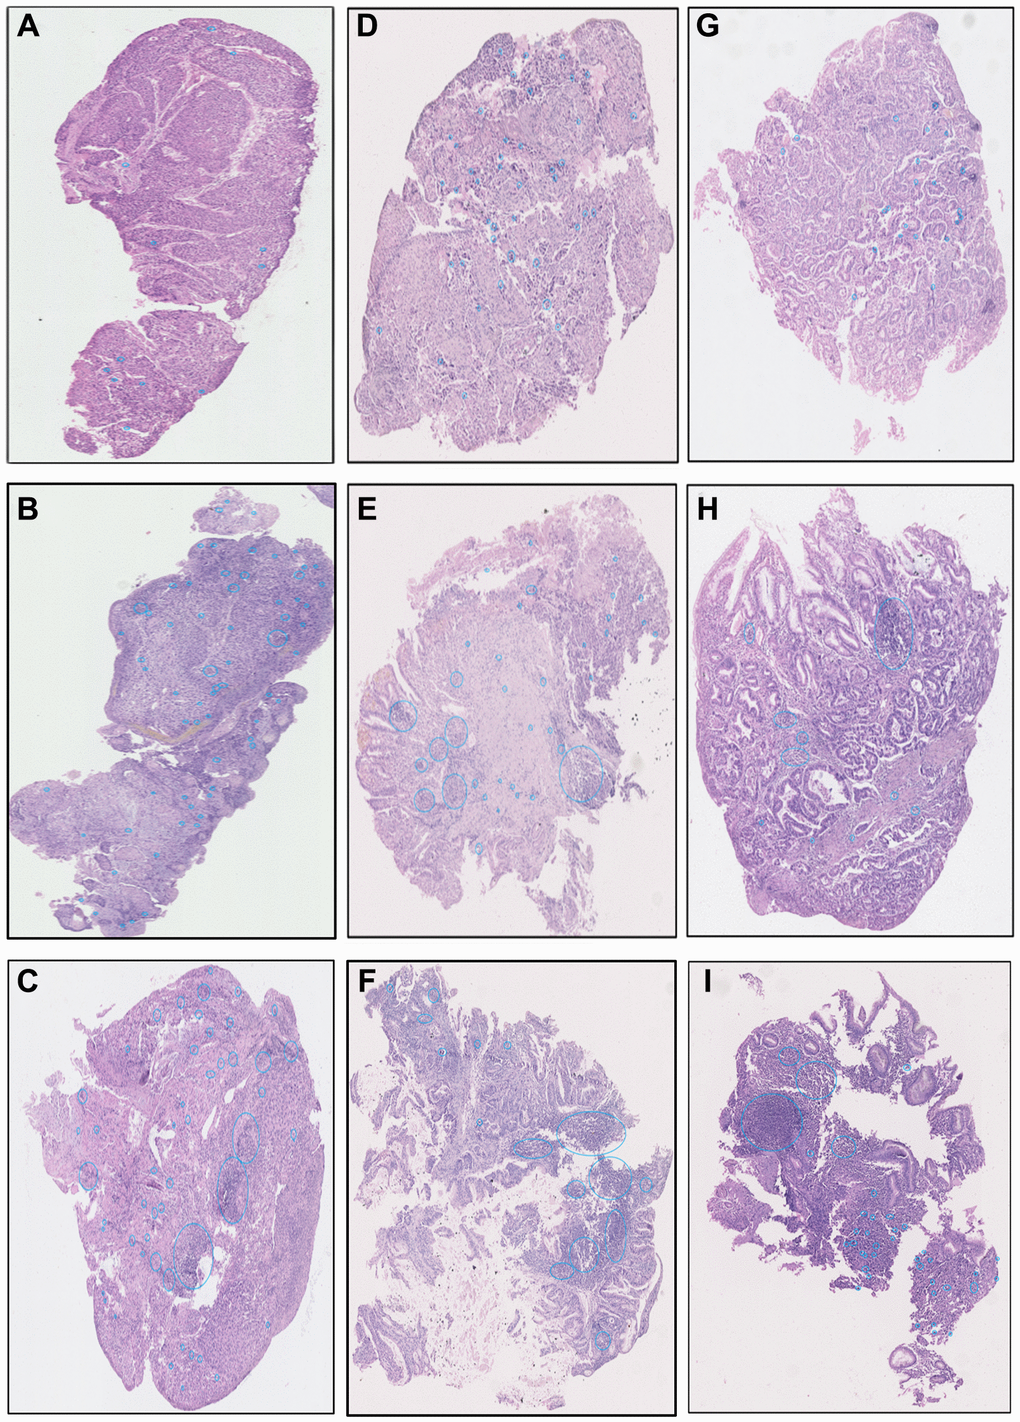
Figure 2.The examples images of low, medium, and high TILs intensity in ESCC (A–C), AEGJ (D–F), and GAC (G–I) H&E-stained tissue sections (H&E×200).
Figure 2 — Characteristics of auto-quantified tumor-infiltrating lymphocytes and the prognostic value in adenocarcinoma of the esophagogastric junction, gastric adenocarcinoma, and esophageal squamous cell carcinoma | Aging