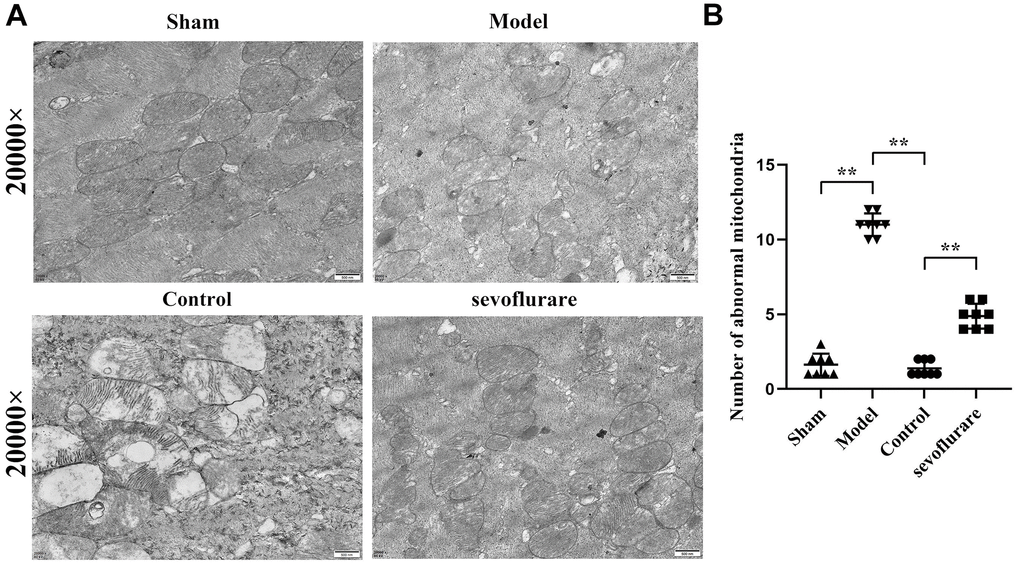
Figure 4.Representative transmission electron microscopic images of mouse lumbosacral spinal cord tissue. (A) Results of transmission electron microscopy, (B) mitochondrial number statistics. Sham group vs. Model group, Model group vs. Sevoflurane group, Control group vs. Sevoflurane group, N=8.