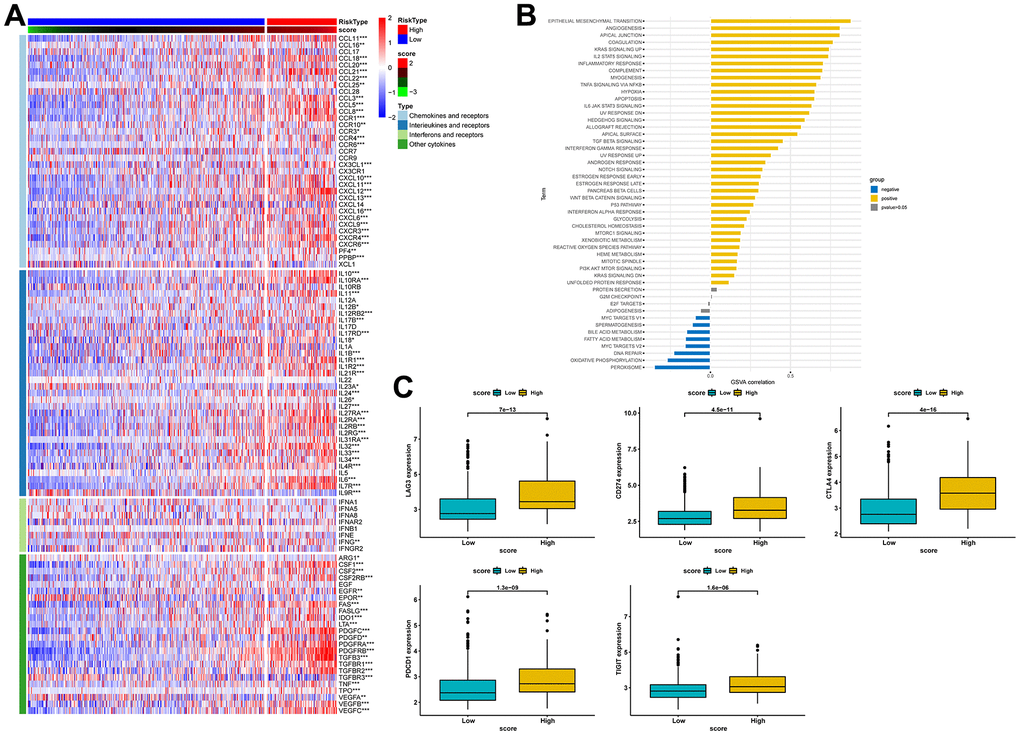
Figure 10.Estimation of the relationship between risk scores and the tumor immune microenvironment. (A) Heat map of cytokine expression in high- and low-score groups. * indicates p<0.05, ** indicates p<0.01, *** indicates p<0.001. (B) Correlations between signature score and HALLMARK pathway. (C) Expression analysis of LAG3, CD274, CTLA-4, PDCD1, and TIGIT between high- and low-risk groups.