Submit an Article
Navigate
Home
Editorial Board
Editorial Policies
Current Volume
Archive
Scientific Integrity
Publication Ethics Statements
Interviews with Outstanding Authors
Newsroom
Sponsored Conferences
Podcast
Contact
Special Collections
Submit an Article
Online ISSN: 1945-4589
Research Paper
|
Volume 16, Issue 17
|
pp. 12312–12334
Identification of a circadian-based prognostic signature predicting cancer-associated fibroblasts infiltration and immunotherapy response in bladder cancer
Back to article
Figure 1
(1 of 11)
−
100%
+
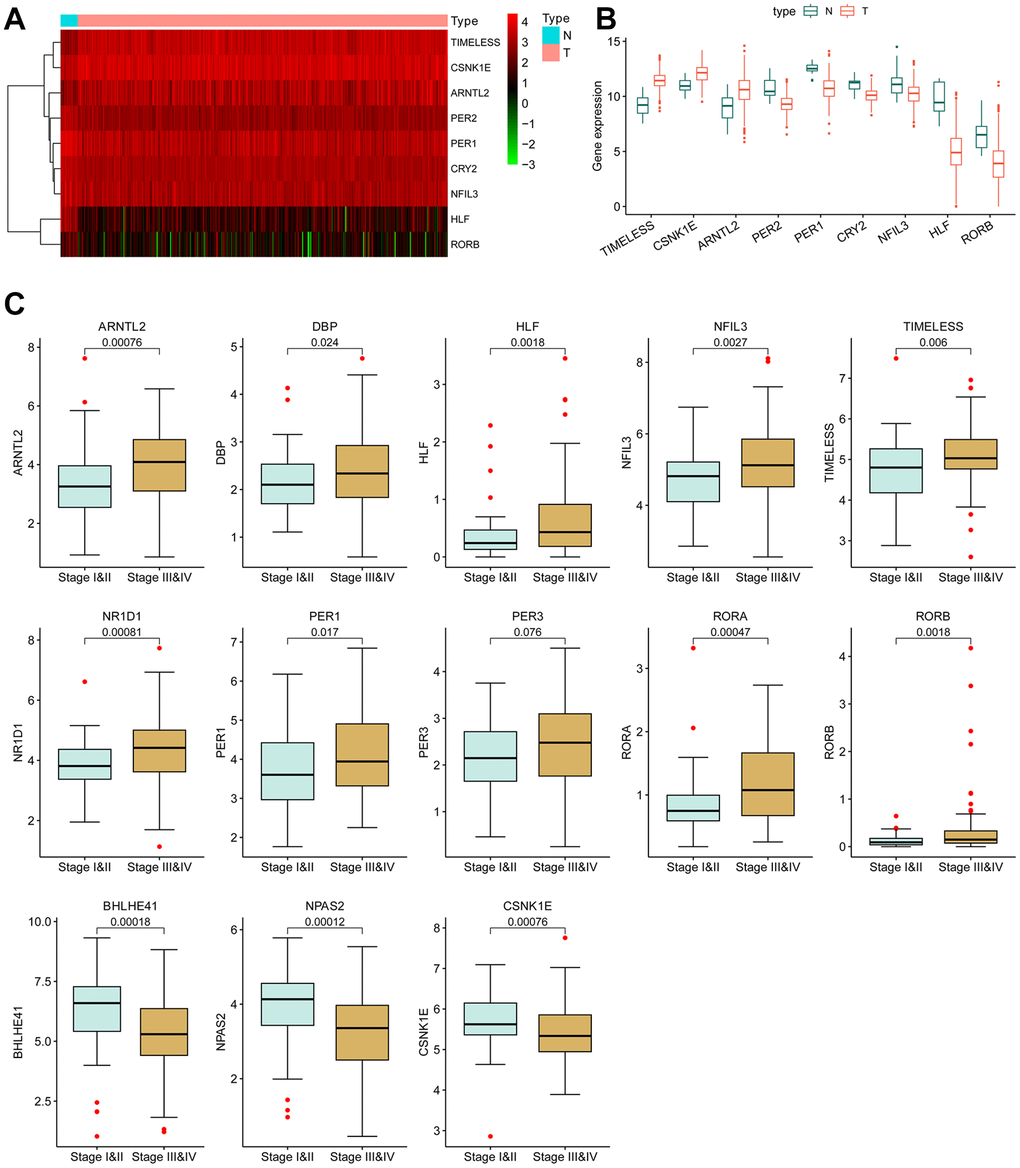
Figure 1.
Differentially expressed circadian rhythm genes in BCLA.
(
A
) Heatmap and (
B
) boxplot of the differentially expressed CCRGs mRNAs between BLCA tumors and normal tissues. (
C
) The correlation of CCRGs mRNAs with tumor stages.