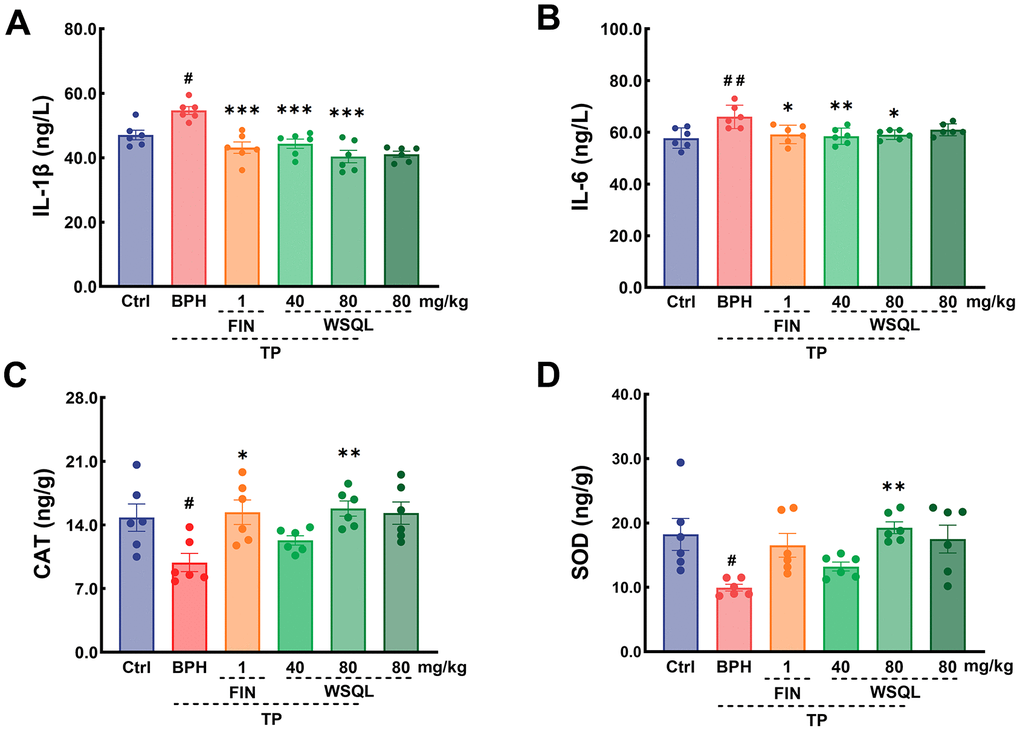
Figure 6.Effect of WSQL on expressions of (A) IL-1β and (B) IL-6 in serum, and (C) CAT, (D) SOD in prostate tissue of mice. Data are expressed as means ± SEM. ##p < 0.01 and #p < 0.05 vs. Ctrl group, *** p < 0.001, ** p < 0.01 and * p <0.05 vs. BPH group. n = 6 for (A–D).