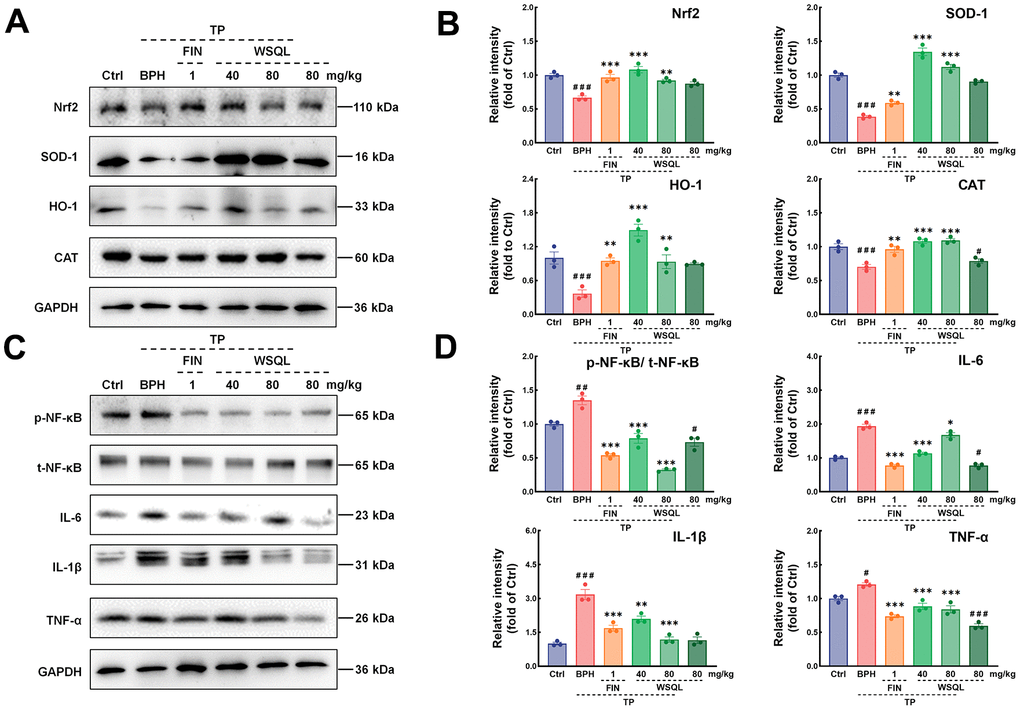
Figure 7.Effects of WSQL on the Nrf2 and NF-κB signaling pathways in the BPH model mice. (A) The protein levels and (B) quantitative analyses of Nrf2, SOD-1, HO-1 and CAT as well as (C) the protein levels and (D) quantitative analyses of p-NF-κB, t-NF-κB, IL-6, IL-1β and TNF-α were determined using western blotting. GAPDH or the corresponding total protein (t-NF-κB) was used as an internal control and were reported as the fold change of the Ctrl group. The data are presented as the mean ± SEM. ###p < 0.001 and #p < 0.05 vs. Ctrl group, *** p < 0.001, ** p < 0.01 and * p < 0.05 vs. BPH group. n = 3 for (A–D).