Submit an Article
Navigate
Home
Editorial Board
Editorial Policies
Current Volume
Archive
Scientific Integrity
Publication Ethics Statements
Interviews with Outstanding Authors
Newsroom
Sponsored Conferences
Podcast
Contact
Special Collections
Submit an Article
Online ISSN: 1945-4589
Research Paper
|
Volume 16, Issue 20
|
pp. 13025–13038
Development and validation of an electronic frailty index in a national health maintenance organization
Back to article
Figure 2
(2 of 3)
−
100%
+
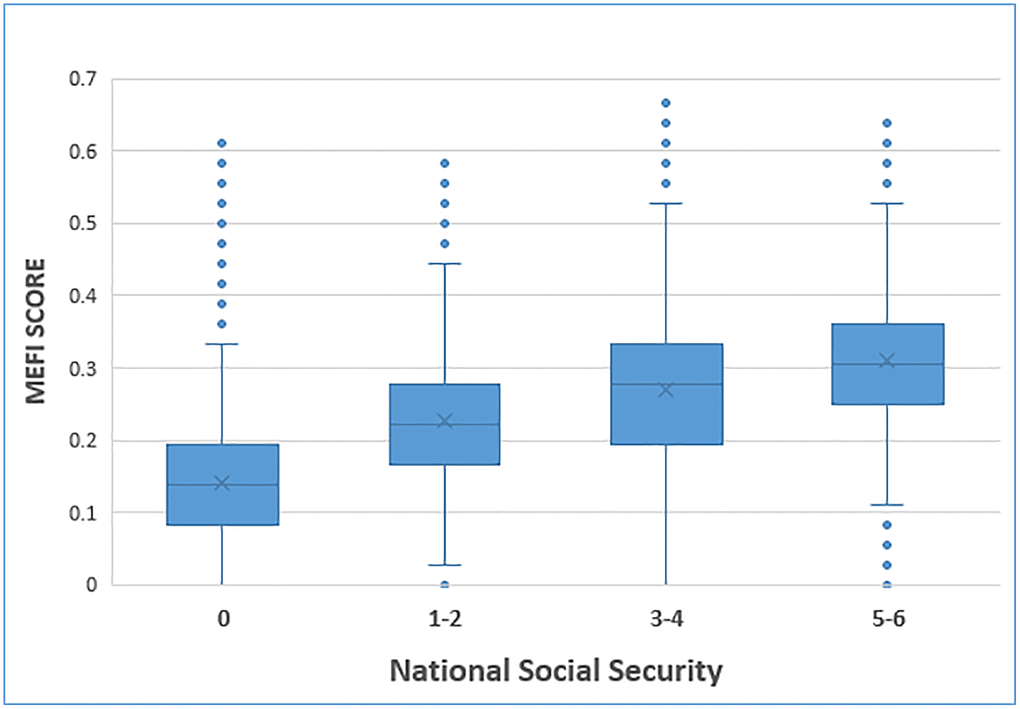
Figure 2.
Boxplot of MEFI grouped by Social Security benefits.