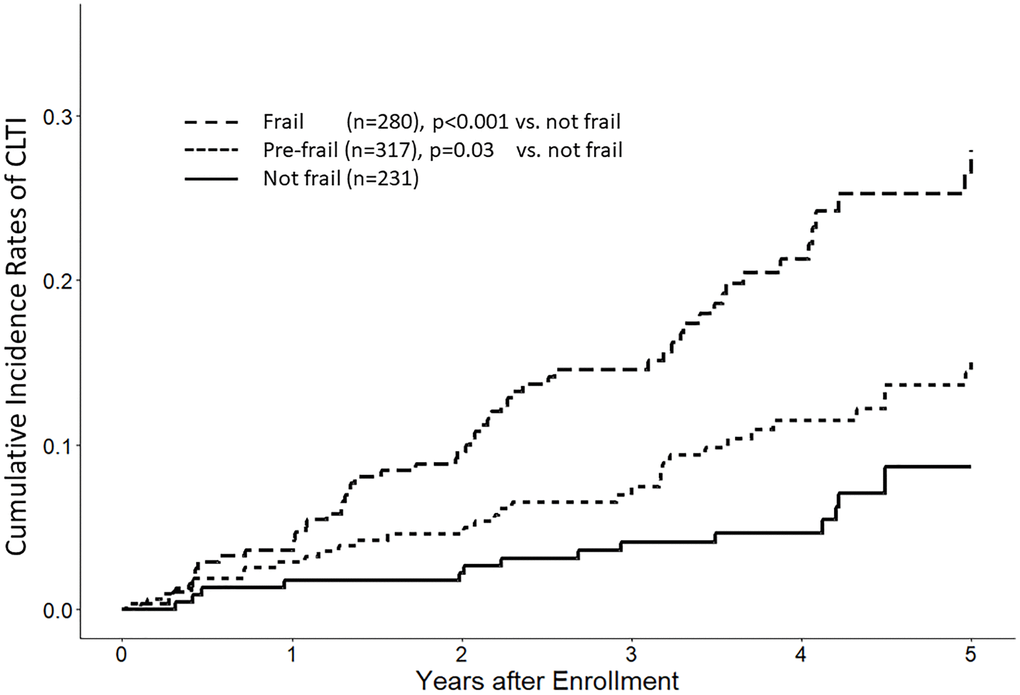
Figure 2.Kaplan–Meier plot of critical limb ischemia events by frailty status. This figure depicts the time to the occurrence of the first chronic limb-threatening ischemia (CLTI) event, categorized based on frailty status.
Figure 2 — Association of frailty and chronic limb-threatening ischemia in patients on maintenance hemodialysis: a prospective cohort study | Aging