Submit an Article
Navigate
Home
Editorial Board
Editorial Policies
Current Volume
Archive
Scientific Integrity
Publication Ethics Statements
Interviews with Outstanding Authors
Newsroom
Sponsored Conferences
Podcast
Contact
Special Collections
Submit an Article
Online ISSN: 1945-4589
Research Paper
|
Volume 17, Issue 1
|
pp. 67–96
Characterization of DNA methylation clock algorithms applied to diverse tissue types
Back to article
Figure 3
(3 of 4)
−
100%
+
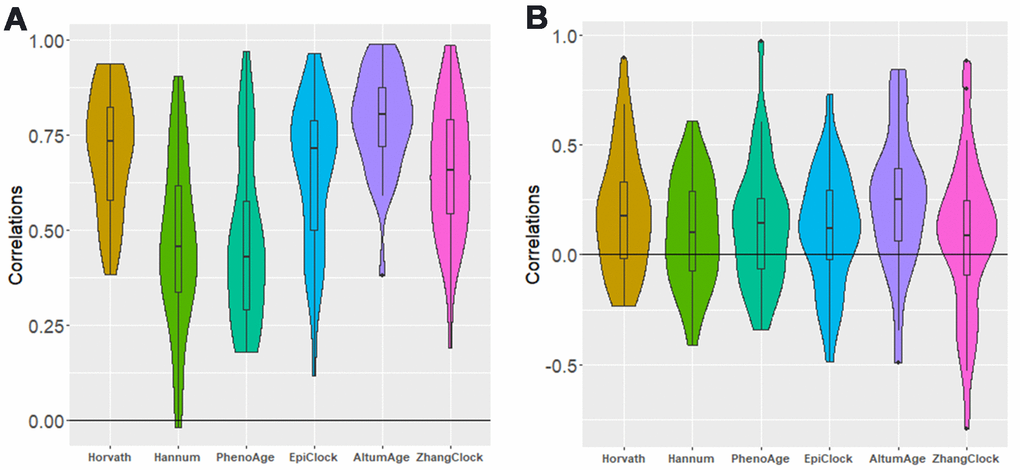
Figure 3.
Distribution of between-tissue correlations for each clock, for all possible pairs of tissue types.
(
A
) not adjusted for age (
B
) adjusted for age. Each of the five distributions shown (in both panels) has a mean greater than zero (P<0.05).