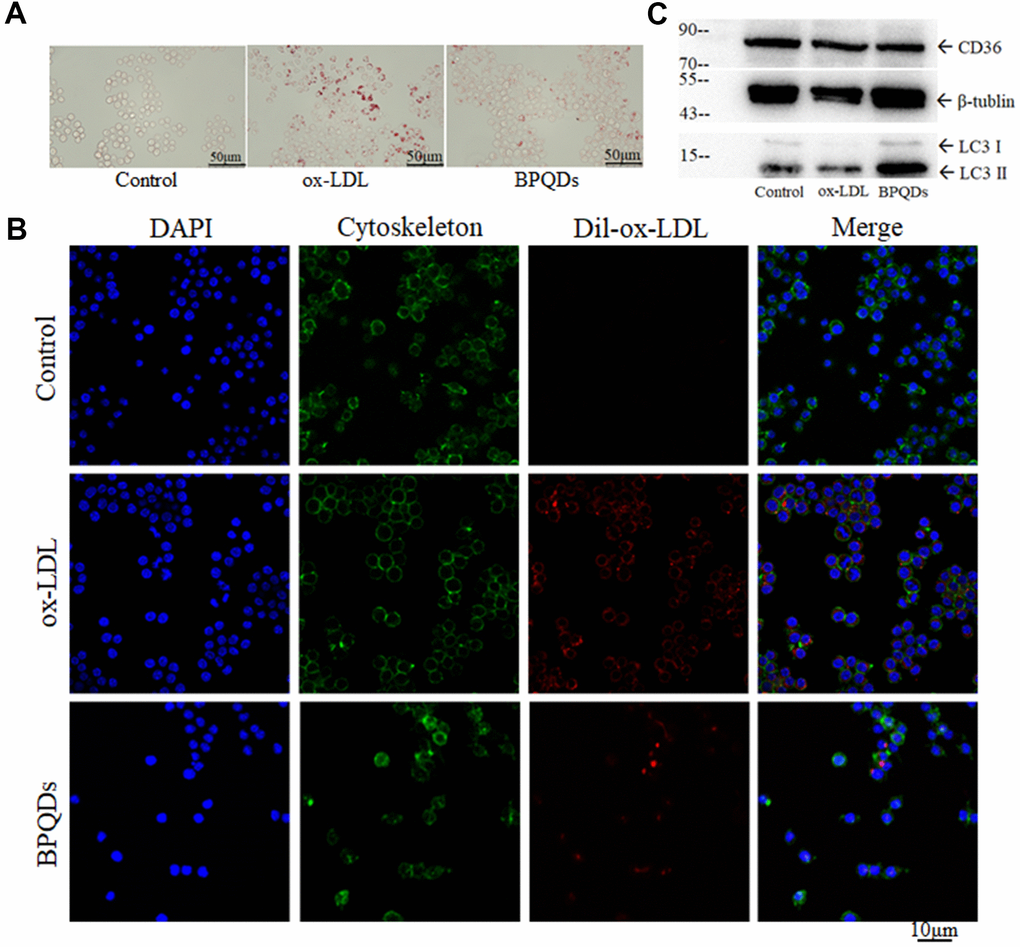
Figure 6.(A) Oil red O staining of macrophages/foam cells. (B) Fluorescence intensity of ox-LDL observed by confocal. (C) Western blot of CD36 and LC3 II / I.
Figure 6 — Study on the use of black phosphorus quantum dots in the treatment of atherosclerosis | Aging