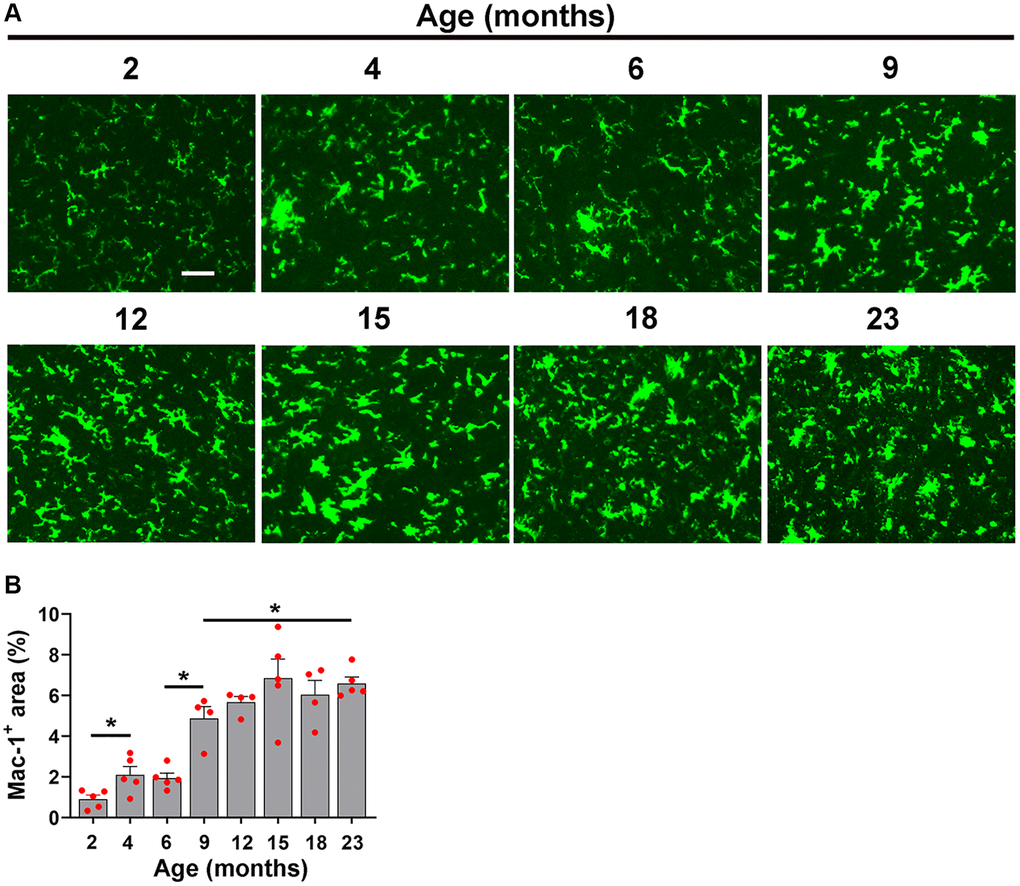
Figure 6.Characterization of hypoxia-induced microglial activation at different ages. (A) Frozen brain sections taken from mice of different ages (2–23 months) exposed to hypoxia (8% O2) for 4 days were labelled with Mac-1 (AlexaFluor-488). Images were captured in the midbrain. Scale bars = 100 μm. (B) Quantification of the Mac-1 area in the midbrain in different age mice following 4 days hypoxia. Results are expressed as the mean ± standard error of the mean (SEM) (n = 5 mice/group). *p < 0.05. One-way analysis of variance (ANOVA) followed by Tukey’s multiple comparison post-hoc test. Note that the Mac-1 signal increased in a stepwise manner from 2 months and increasing steadily all the way up to 15 months, after which time it plateaued.