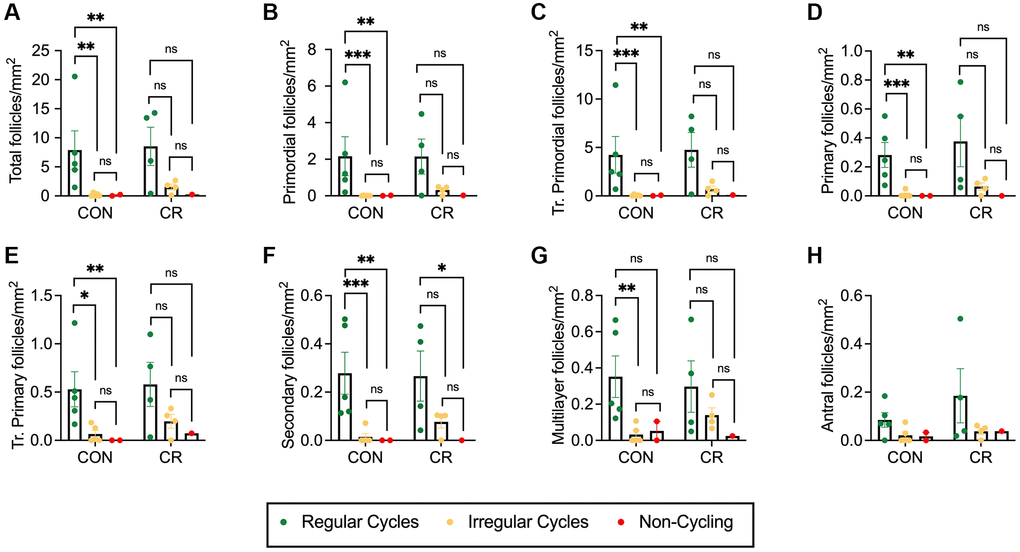
Figure 5.Follicle number per area as a function of reproductive status. Bar graphs showing follicle number per area for each normal follicle morphology class: (A) total number of follicles, (B) primordial, (C) transitional primordial, (D) primary, (E) transitional primary, (F) secondary, (G) multilayer, and (H) antral. Follicle number per area is plotted as untransformed data. Data presented as mean ± SEM. Green circles represent animals with regular cycles, yellow circles represent animals with irregular cycles, and red circles represent non-cycling animals. Statistics were calculated on log-transformed data with a two-way ANOVA. Tukey’s post hoc test was applied when one or both of the main effects were statistically significant. *p ≤ 0.05, **p ≤ 0.01, ***p ≤ 0.001. P-values for sources of variation of two-way ANOVA can be found in Supplementary Table 5.