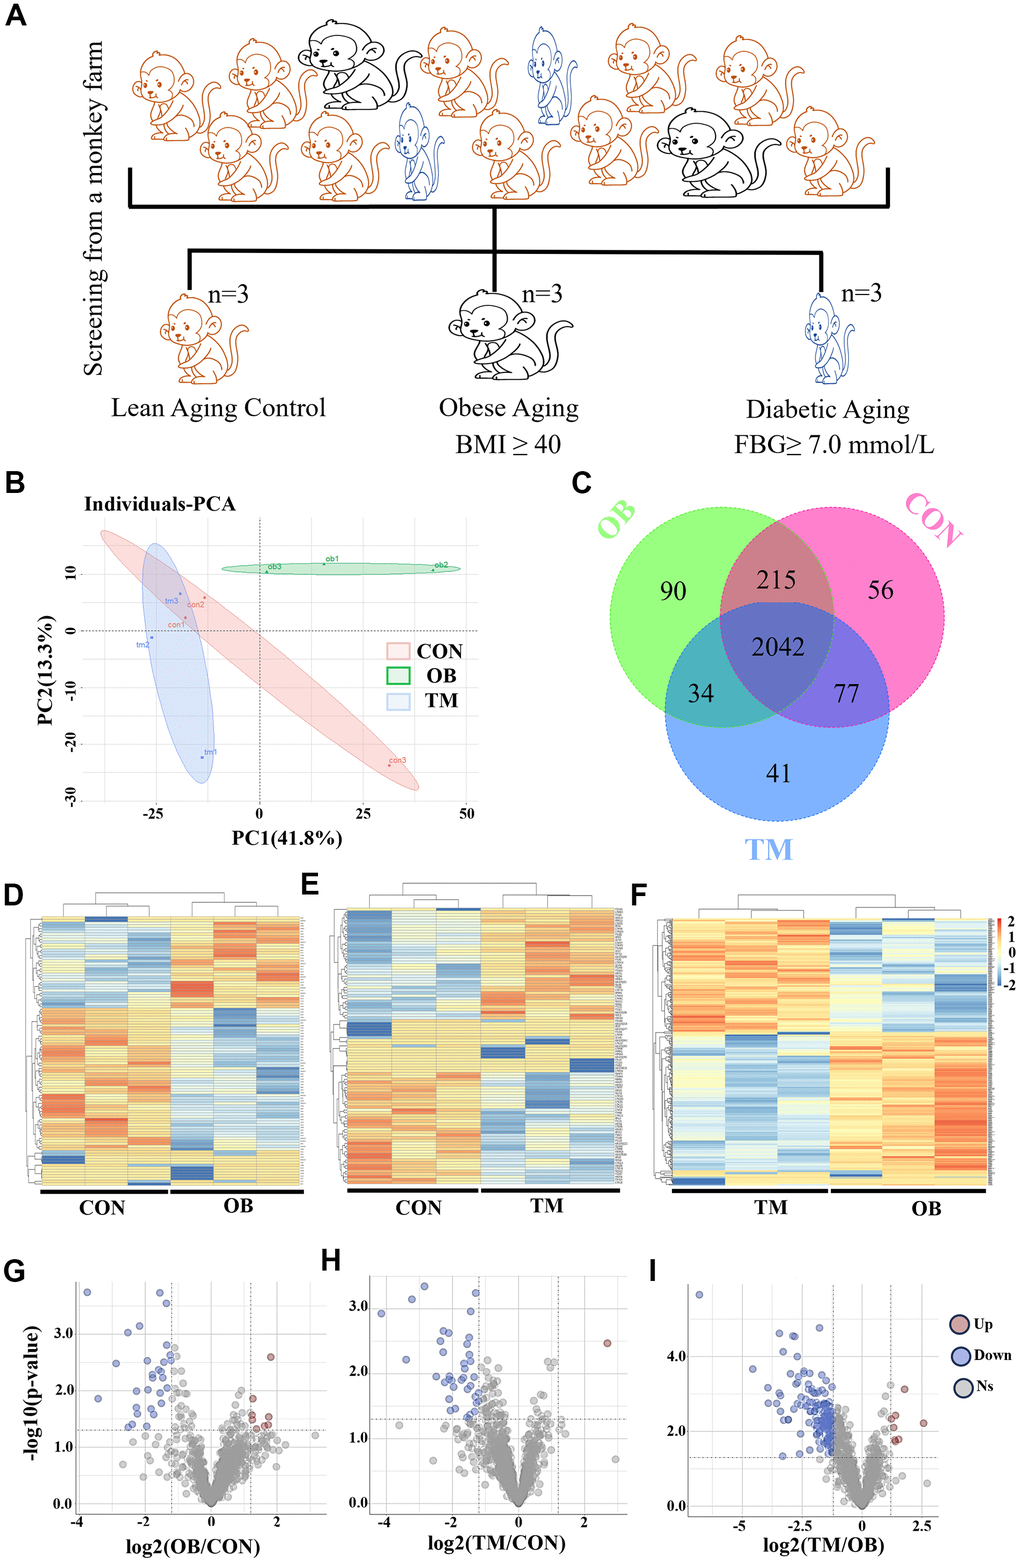
Figure 1.Proteomic analysis reveals cardiac tissue alterations in obesity (OB) and type 2 diabetes (TM) monkeys. (A) Identification and screening process for spontaneously obese and type 2 diabetic aging monkeys from a monkey farm. (B) PCA plot demonstrating the distinct proteomic profiles among the CON, OB, and TM groups. (C) Venn diagram illustrates the overlap and uniqueness of detected proteins across the three groups. (D–F) Heatmaps depicting the expression patterns of differentially expressed proteins in each group. (G–I) Volcano plots highlighting the significant differentially expressed proteins selected for further analysis.