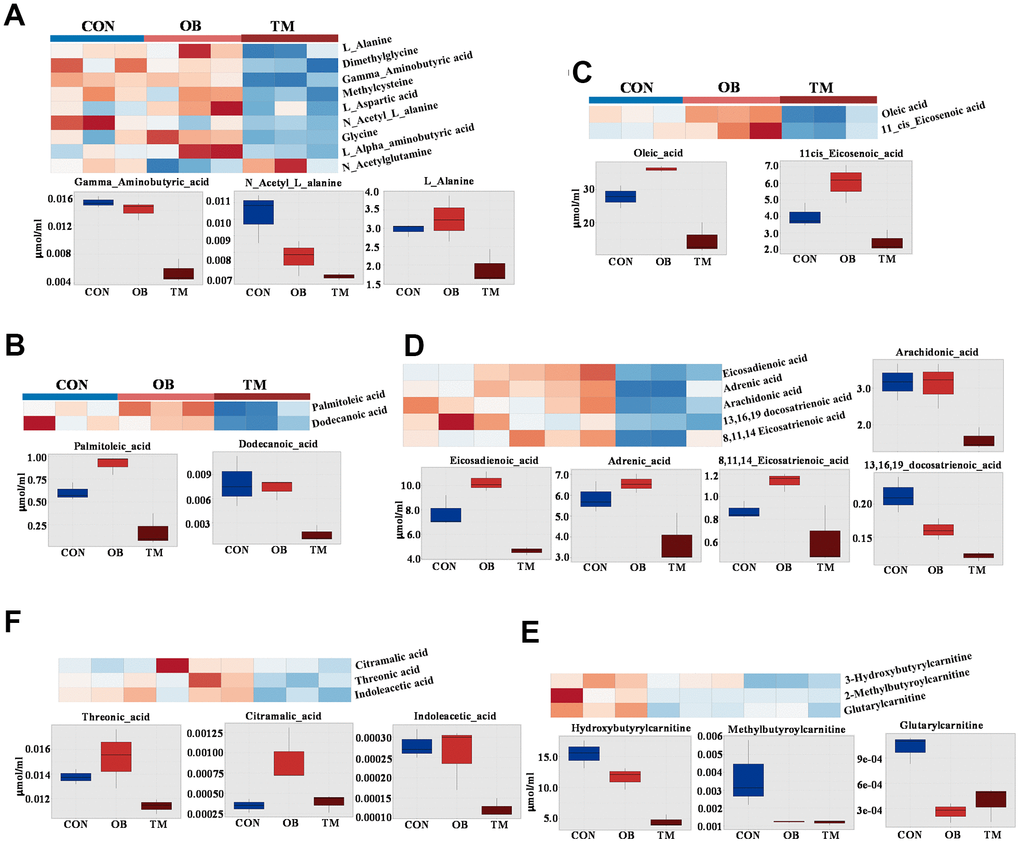
Figure 4.Comparative metabolite profiles in control (CON), obesity (OB), and type 2 diabetes (TM) groups. (A) Heatmap and box graph depicting the differential amino acid levels in the CON, OB, and TM groups, showcasing distinct metabolic patterns. (B) Heatmap and box graph illustrating the variations in saturated fatty acids in the CON, OB, and TM groups, highlighting metabolic alterations. (C) Heatmap and box graph displaying the differences in monounsaturated fatty acids across the CON, OB, and TM groups. (D) Heatmap and box graph showing the changes in polyunsaturated fatty acids among the CON, OB, and TM groups. (E) Heatmap and box graph representing the differential short-chain carnitine levels in the CON, OB, and TM groups, indicating shifts in fatty acid metabolism. (F) Heatmap and box graph presenting the differential organic acid levels in the CON, OB, and TM groups, reflecting alterations in key metabolic pathways.