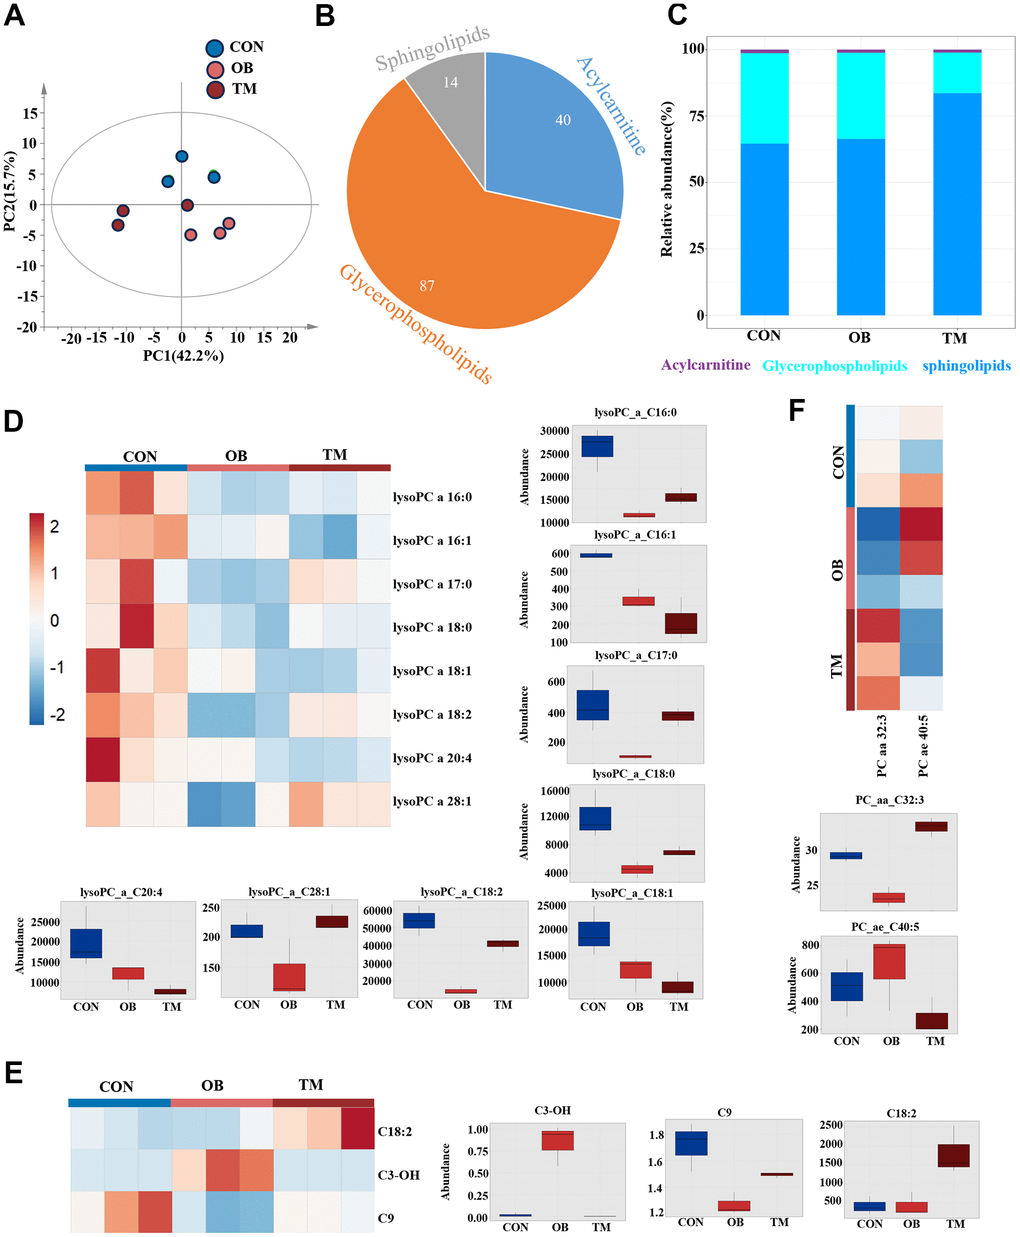
Figure 5.Lipidomic variations among CON, OB, and TM groups. (A) PCA plot delineating the lipidomic distinctions among the CON, OB, and TM groups. (B) Pie graph illustrates the ratio of detected sphingolipids, acylcarnitines, and glycerophospholipids across the CON, OB, and TM groups. (C) Bar graph shows the relative abundance of sphingolipids, acylcarnitines, and glycerophospholipids in the CON, OB, and TM groups. (D) Heatmap and box graph displaying lysoPC levels in the CON, OB, and TM groups, revealing metabolic variations. (E) Heatmap and box graph presenting acylcarnitine levels in the CON, OB, and TM groups, indicating alterations in lipid metabolism. (F) Heatmap and box graph depicting phosphatidylcholine (PC) levels in the CON, OB, and TM groups, highlighting differences in lipid profiles.